Immigrants from Haiti vs Immigrants from Taiwan Disability Age 65 to 74
COMPARE
Immigrants from Haiti
Immigrants from Taiwan
Disability Age 65 to 74
Disability Age 65 to 74 Comparison
Immigrants from Haiti
Immigrants from Taiwan
23.4%
DISABILITY AGE 65 TO 74
47.5/ 100
METRIC RATING
177th/ 347
METRIC RANK
18.8%
DISABILITY AGE 65 TO 74
100.0/ 100
METRIC RATING
1st/ 347
METRIC RANK
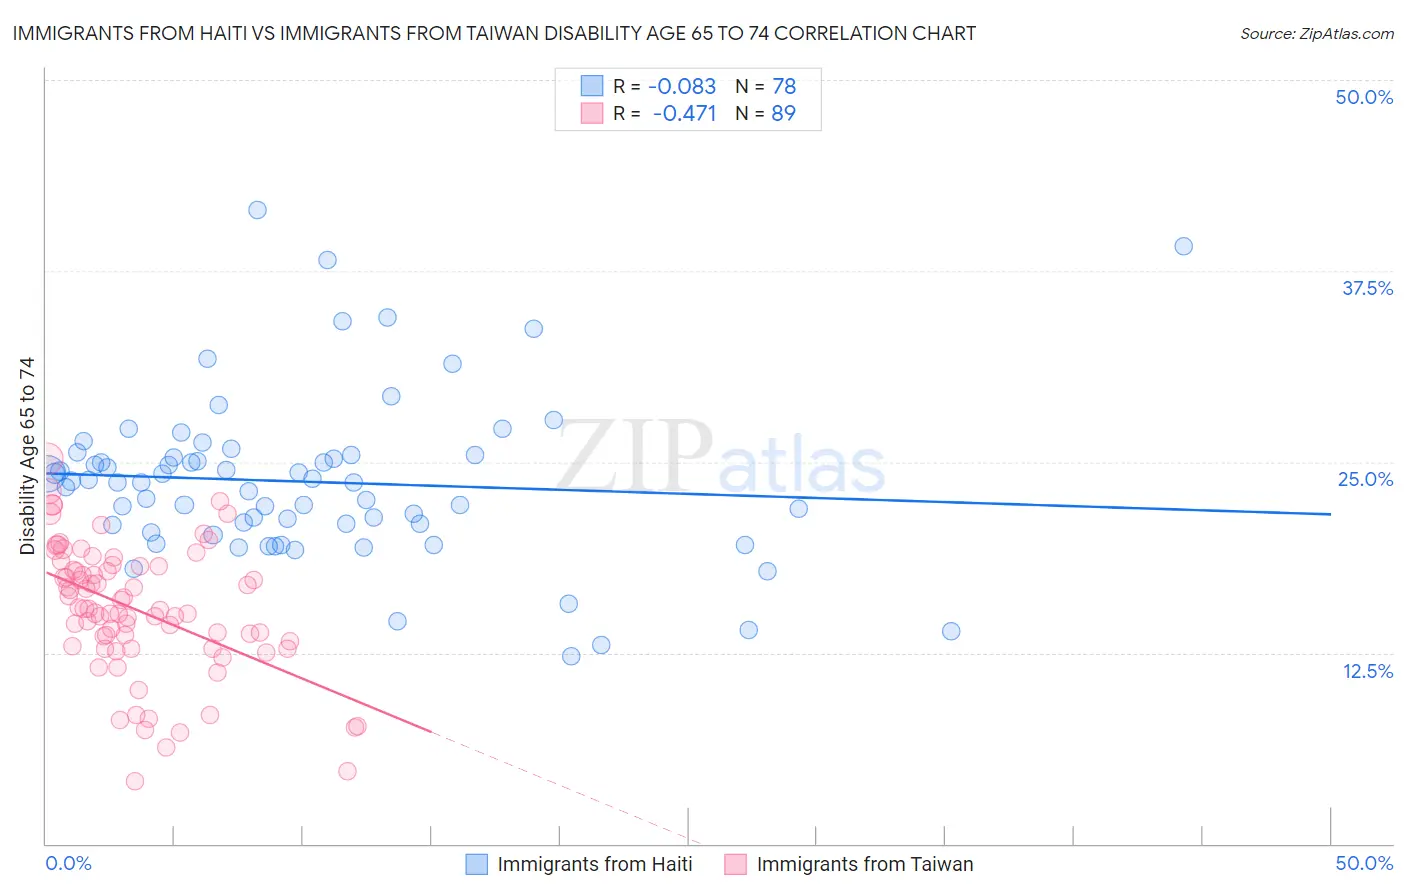
Immigrants from Haiti vs Immigrants from Taiwan Disability Age 65 to 74 Correlation Chart
The statistical analysis conducted on geographies consisting of 224,915,103 people shows a slight negative correlation between the proportion of Immigrants from Haiti and percentage of population with a disability between the ages 65 and 75 in the United States with a correlation coefficient (R) of -0.083 and weighted average of 23.4%. Similarly, the statistical analysis conducted on geographies consisting of 297,907,206 people shows a moderate negative correlation between the proportion of Immigrants from Taiwan and percentage of population with a disability between the ages 65 and 75 in the United States with a correlation coefficient (R) of -0.471 and weighted average of 18.8%, a difference of 24.5%.
Disability Age 65 to 74 Correlation Summary
| Measurement | Immigrants from Haiti | Immigrants from Taiwan |
| Minimum | 12.3% | 4.1% |
| Maximum | 41.5% | 25.2% |
| Range | 29.2% | 21.2% |
| Mean | 23.7% | 15.3% |
| Median | 23.7% | 15.4% |
| Interquartile 25% (IQ1) | 20.9% | 12.9% |
| Interquartile 75% (IQ3) | 25.4% | 18.2% |
| Interquartile Range (IQR) | 4.6% | 5.3% |
| Standard Deviation (Sample) | 5.4% | 4.3% |
| Standard Deviation (Population) | 5.4% | 4.3% |
Similar Demographics by Disability Age 65 to 74
Demographics Similar to Immigrants from Haiti by Disability Age 65 to 74
In terms of disability age 65 to 74, the demographic groups most similar to Immigrants from Haiti are Immigrants from Eritrea (23.4%, a difference of 0.0%), Guyanese (23.4%, a difference of 0.10%), Immigrants from Sierra Leone (23.4%, a difference of 0.10%), Dutch (23.3%, a difference of 0.11%), and Scandinavian (23.4%, a difference of 0.11%).
| Demographics | Rating | Rank | Disability Age 65 to 74 |
| Moroccans | 54.2 /100 | #170 | Average 23.3% |
| Cubans | 51.9 /100 | #171 | Average 23.3% |
| Germans | 50.5 /100 | #172 | Average 23.3% |
| Yugoslavians | 50.2 /100 | #173 | Average 23.3% |
| Immigrants | South Eastern Asia | 50.0 /100 | #174 | Average 23.3% |
| Dutch | 49.4 /100 | #175 | Average 23.3% |
| Immigrants | Eritrea | 47.5 /100 | #176 | Average 23.4% |
| Immigrants | Haiti | 47.5 /100 | #177 | Average 23.4% |
| Guyanese | 45.8 /100 | #178 | Average 23.4% |
| Immigrants | Sierra Leone | 45.8 /100 | #179 | Average 23.4% |
| Scandinavians | 45.6 /100 | #180 | Average 23.4% |
| Assyrians/Chaldeans/Syriacs | 45.3 /100 | #181 | Average 23.4% |
| Irish | 44.4 /100 | #182 | Average 23.4% |
| Immigrants | Eastern Africa | 42.8 /100 | #183 | Average 23.4% |
| Immigrants | Germany | 42.5 /100 | #184 | Average 23.4% |
Demographics Similar to Immigrants from Taiwan by Disability Age 65 to 74
In terms of disability age 65 to 74, the demographic groups most similar to Immigrants from Taiwan are Filipino (19.0%, a difference of 1.2%), Immigrants from India (19.7%, a difference of 4.9%), Immigrants from Hong Kong (19.9%, a difference of 5.8%), Immigrants from Israel (19.9%, a difference of 6.1%), and Iranian (19.9%, a difference of 6.2%).
| Demographics | Rating | Rank | Disability Age 65 to 74 |
| Immigrants | Taiwan | 100.0 /100 | #1 | Exceptional 18.8% |
| Filipinos | 100.0 /100 | #2 | Exceptional 19.0% |
| Immigrants | India | 100.0 /100 | #3 | Exceptional 19.7% |
| Immigrants | Hong Kong | 100.0 /100 | #4 | Exceptional 19.9% |
| Immigrants | Israel | 100.0 /100 | #5 | Exceptional 19.9% |
| Iranians | 100.0 /100 | #6 | Exceptional 19.9% |
| Cypriots | 100.0 /100 | #7 | Exceptional 20.1% |
| Thais | 100.0 /100 | #8 | Exceptional 20.1% |
| Immigrants | China | 100.0 /100 | #9 | Exceptional 20.3% |
| Immigrants | Eastern Asia | 100.0 /100 | #10 | Exceptional 20.3% |
| Immigrants | Ireland | 100.0 /100 | #11 | Exceptional 20.3% |
| Immigrants | Korea | 100.0 /100 | #12 | Exceptional 20.4% |
| Immigrants | Singapore | 100.0 /100 | #13 | Exceptional 20.4% |
| Indians (Asian) | 100.0 /100 | #14 | Exceptional 20.5% |
| Paraguayans | 100.0 /100 | #15 | Exceptional 20.5% |