Slavic vs Blackfeet Ambulatory Disability
COMPARE
Slavic
Blackfeet
Ambulatory Disability
Ambulatory Disability Comparison
Slavs
Blackfeet
6.4%
AMBULATORY DISABILITY
5.1/ 100
METRIC RATING
226th/ 347
METRIC RANK
7.1%
AMBULATORY DISABILITY
0.0/ 100
METRIC RATING
314th/ 347
METRIC RANK
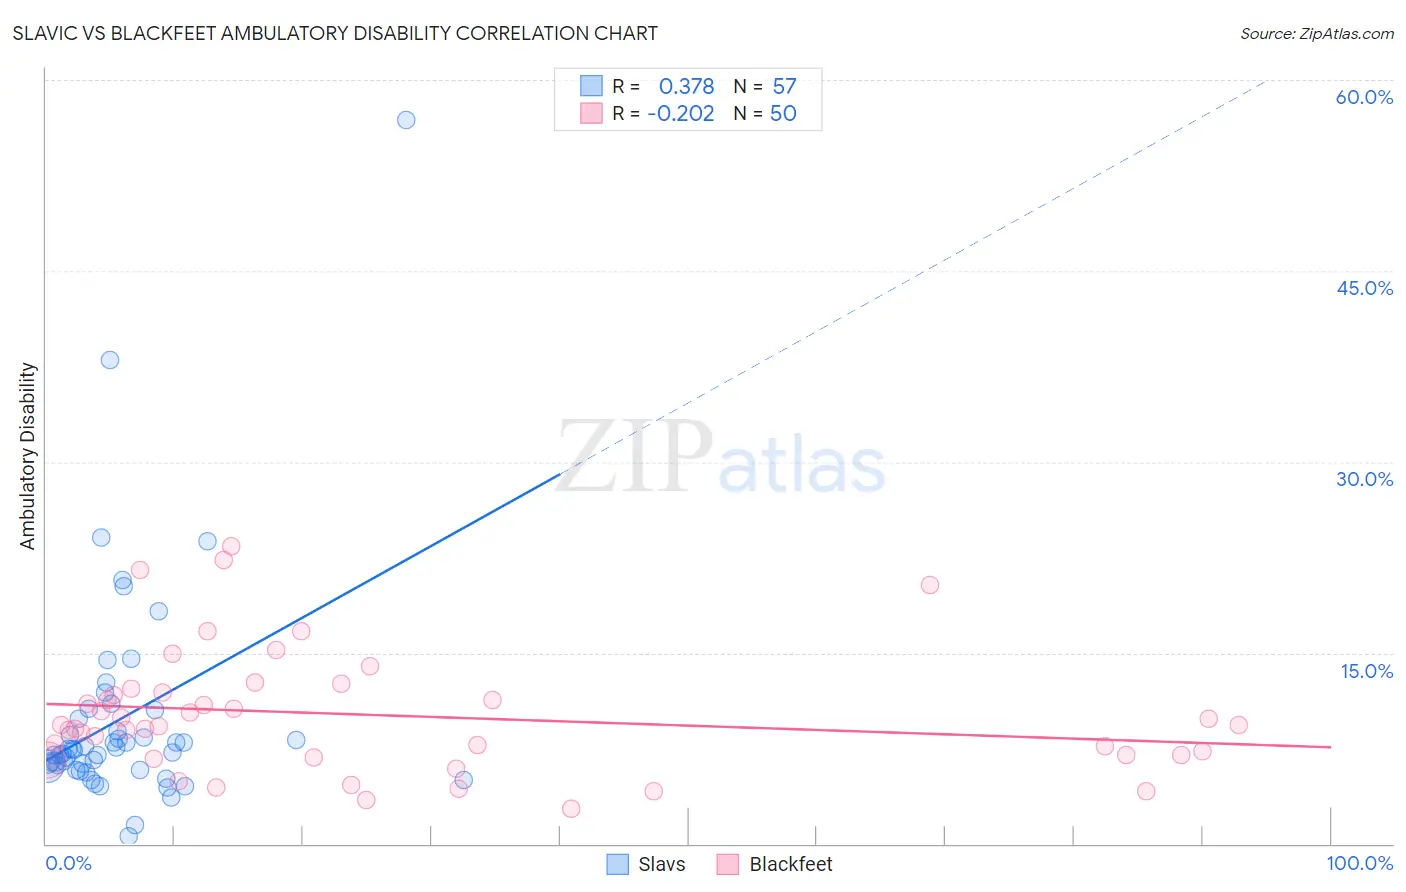
Slavic vs Blackfeet Ambulatory Disability Correlation Chart
The statistical analysis conducted on geographies consisting of 270,841,437 people shows a mild positive correlation between the proportion of Slavs and percentage of population with ambulatory disability in the United States with a correlation coefficient (R) of 0.378 and weighted average of 6.4%. Similarly, the statistical analysis conducted on geographies consisting of 309,475,903 people shows a weak negative correlation between the proportion of Blackfeet and percentage of population with ambulatory disability in the United States with a correlation coefficient (R) of -0.202 and weighted average of 7.1%, a difference of 12.2%.
Ambulatory Disability Correlation Summary
| Measurement | Slavic | Blackfeet |
| Minimum | 0.58% | 2.7% |
| Maximum | 56.8% | 23.4% |
| Range | 56.3% | 20.7% |
| Mean | 9.9% | 10.1% |
| Median | 7.4% | 9.2% |
| Interquartile 25% (IQ1) | 6.0% | 6.9% |
| Interquartile 75% (IQ3) | 10.2% | 11.9% |
| Interquartile Range (IQR) | 4.2% | 5.0% |
| Standard Deviation (Sample) | 8.9% | 4.8% |
| Standard Deviation (Population) | 8.8% | 4.8% |
Similar Demographics by Ambulatory Disability
Demographics Similar to Slavs by Ambulatory Disability
In terms of ambulatory disability, the demographic groups most similar to Slavs are Honduran (6.3%, a difference of 0.27%), Cuban (6.4%, a difference of 0.33%), Portuguese (6.4%, a difference of 0.34%), Czechoslovakian (6.4%, a difference of 0.39%), and Liberian (6.3%, a difference of 0.44%).
| Demographics | Rating | Rank | Ambulatory Disability |
| Indonesians | 9.9 /100 | #219 | Tragic 6.3% |
| Immigrants | Albania | 9.6 /100 | #220 | Tragic 6.3% |
| Hungarians | 9.6 /100 | #221 | Tragic 6.3% |
| German Russians | 9.4 /100 | #222 | Tragic 6.3% |
| Immigrants | Honduras | 7.6 /100 | #223 | Tragic 6.3% |
| Liberians | 7.1 /100 | #224 | Tragic 6.3% |
| Hondurans | 6.3 /100 | #225 | Tragic 6.3% |
| Slavs | 5.1 /100 | #226 | Tragic 6.4% |
| Cubans | 4.0 /100 | #227 | Tragic 6.4% |
| Portuguese | 4.0 /100 | #228 | Tragic 6.4% |
| Czechoslovakians | 3.8 /100 | #229 | Tragic 6.4% |
| Mexicans | 3.5 /100 | #230 | Tragic 6.4% |
| Panamanians | 3.1 /100 | #231 | Tragic 6.4% |
| Assyrians/Chaldeans/Syriacs | 2.4 /100 | #232 | Tragic 6.4% |
| Sub-Saharan Africans | 2.3 /100 | #233 | Tragic 6.4% |
Demographics Similar to Blackfeet by Ambulatory Disability
In terms of ambulatory disability, the demographic groups most similar to Blackfeet are Immigrants from Yemen (7.1%, a difference of 0.020%), Shoshone (7.1%, a difference of 0.020%), Delaware (7.1%, a difference of 0.15%), Immigrants from Dominican Republic (7.1%, a difference of 0.26%), and Central American Indian (7.2%, a difference of 0.34%).
| Demographics | Rating | Rank | Ambulatory Disability |
| Spanish Americans | 0.0 /100 | #307 | Tragic 7.1% |
| Chippewa | 0.0 /100 | #308 | Tragic 7.1% |
| Immigrants | Azores | 0.0 /100 | #309 | Tragic 7.1% |
| Arapaho | 0.0 /100 | #310 | Tragic 7.1% |
| Cree | 0.0 /100 | #311 | Tragic 7.1% |
| Delaware | 0.0 /100 | #312 | Tragic 7.1% |
| Immigrants | Yemen | 0.0 /100 | #313 | Tragic 7.1% |
| Blackfeet | 0.0 /100 | #314 | Tragic 7.1% |
| Shoshone | 0.0 /100 | #315 | Tragic 7.1% |
| Immigrants | Dominican Republic | 0.0 /100 | #316 | Tragic 7.1% |
| Central American Indians | 0.0 /100 | #317 | Tragic 7.2% |
| Ottawa | 0.0 /100 | #318 | Tragic 7.2% |
| Dominicans | 0.0 /100 | #319 | Tragic 7.2% |
| Potawatomi | 0.0 /100 | #320 | Tragic 7.3% |
| Apache | 0.0 /100 | #321 | Tragic 7.4% |