Pennsylvania German vs Nonimmigrants Ambulatory Disability
COMPARE
Pennsylvania German
Nonimmigrants
Ambulatory Disability
Ambulatory Disability Comparison
Pennsylvania Germans
Nonimmigrants
6.8%
AMBULATORY DISABILITY
0.0/ 100
METRIC RATING
280th/ 347
METRIC RANK
6.9%
AMBULATORY DISABILITY
0.0/ 100
METRIC RATING
288th/ 347
METRIC RANK
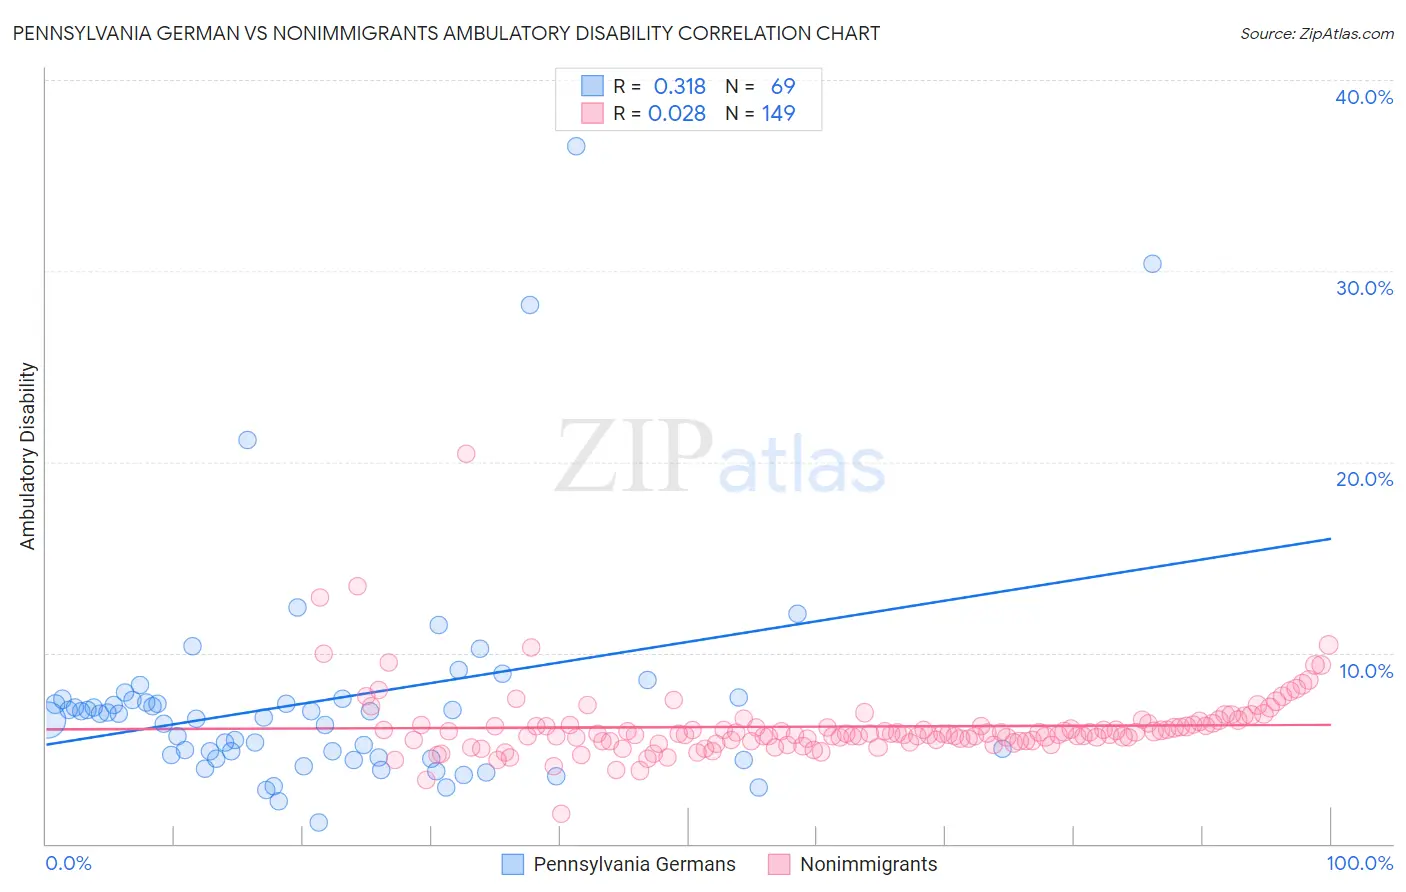
Pennsylvania German vs Nonimmigrants Ambulatory Disability Correlation Chart
The statistical analysis conducted on geographies consisting of 234,073,505 people shows a mild positive correlation between the proportion of Pennsylvania Germans and percentage of population with ambulatory disability in the United States with a correlation coefficient (R) of 0.318 and weighted average of 6.8%. Similarly, the statistical analysis conducted on geographies consisting of 584,325,810 people shows no correlation between the proportion of Nonimmigrants and percentage of population with ambulatory disability in the United States with a correlation coefficient (R) of 0.028 and weighted average of 6.9%, a difference of 1.5%.
Ambulatory Disability Correlation Summary
| Measurement | Pennsylvania German | Nonimmigrants |
| Minimum | 1.1% | 1.6% |
| Maximum | 36.5% | 20.4% |
| Range | 35.4% | 18.8% |
| Mean | 7.5% | 6.1% |
| Median | 6.8% | 5.8% |
| Interquartile 25% (IQ1) | 4.5% | 5.4% |
| Interquartile 75% (IQ3) | 7.5% | 6.2% |
| Interquartile Range (IQR) | 3.1% | 0.88% |
| Standard Deviation (Sample) | 6.0% | 1.9% |
| Standard Deviation (Population) | 5.9% | 1.9% |
Demographics Similar to Pennsylvania Germans and Nonimmigrants by Ambulatory Disability
In terms of ambulatory disability, the demographic groups most similar to Pennsylvania Germans are Yaqui (6.8%, a difference of 0.070%), Immigrants from Caribbean (6.7%, a difference of 0.10%), Barbadian (6.8%, a difference of 0.20%), Immigrants from Barbados (6.8%, a difference of 0.36%), and Immigrants from West Indies (6.7%, a difference of 0.41%). Similarly, the demographic groups most similar to Nonimmigrants are Immigrants from Dominica (6.9%, a difference of 0.14%), Scotch-Irish (6.9%, a difference of 0.17%), U.S. Virgin Islander (6.8%, a difference of 0.27%), West Indian (6.9%, a difference of 0.27%), and Cheyenne (6.9%, a difference of 0.33%).
| Demographics | Rating | Rank | Ambulatory Disability |
| Sioux | 0.1 /100 | #274 | Tragic 6.7% |
| Immigrants | Guyana | 0.1 /100 | #275 | Tragic 6.7% |
| Celtics | 0.1 /100 | #276 | Tragic 6.7% |
| Jamaicans | 0.1 /100 | #277 | Tragic 6.7% |
| Immigrants | West Indies | 0.1 /100 | #278 | Tragic 6.7% |
| Immigrants | Caribbean | 0.0 /100 | #279 | Tragic 6.7% |
| Pennsylvania Germans | 0.0 /100 | #280 | Tragic 6.8% |
| Yaqui | 0.0 /100 | #281 | Tragic 6.8% |
| Barbadians | 0.0 /100 | #282 | Tragic 6.8% |
| Immigrants | Barbados | 0.0 /100 | #283 | Tragic 6.8% |
| Immigrants | Jamaica | 0.0 /100 | #284 | Tragic 6.8% |
| Fijians | 0.0 /100 | #285 | Tragic 6.8% |
| Yakama | 0.0 /100 | #286 | Tragic 6.8% |
| U.S. Virgin Islanders | 0.0 /100 | #287 | Tragic 6.8% |
| Immigrants | Nonimmigrants | 0.0 /100 | #288 | Tragic 6.9% |
| Immigrants | Dominica | 0.0 /100 | #289 | Tragic 6.9% |
| Scotch-Irish | 0.0 /100 | #290 | Tragic 6.9% |
| West Indians | 0.0 /100 | #291 | Tragic 6.9% |
| Cheyenne | 0.0 /100 | #292 | Tragic 6.9% |
| Immigrants | St. Vincent and the Grenadines | 0.0 /100 | #293 | Tragic 6.9% |
| Cape Verdeans | 0.0 /100 | #294 | Tragic 6.9% |