Sioux vs Immigrants from Romania Disability Age 65 to 74
COMPARE
Sioux
Immigrants from Romania
Disability Age 65 to 74
Disability Age 65 to 74 Comparison
Sioux
Immigrants from Romania
27.3%
DISABILITY AGE 65 TO 74
0.0/ 100
METRIC RATING
308th/ 347
METRIC RANK
21.5%
DISABILITY AGE 65 TO 74
99.5/ 100
METRIC RATING
55th/ 347
METRIC RANK
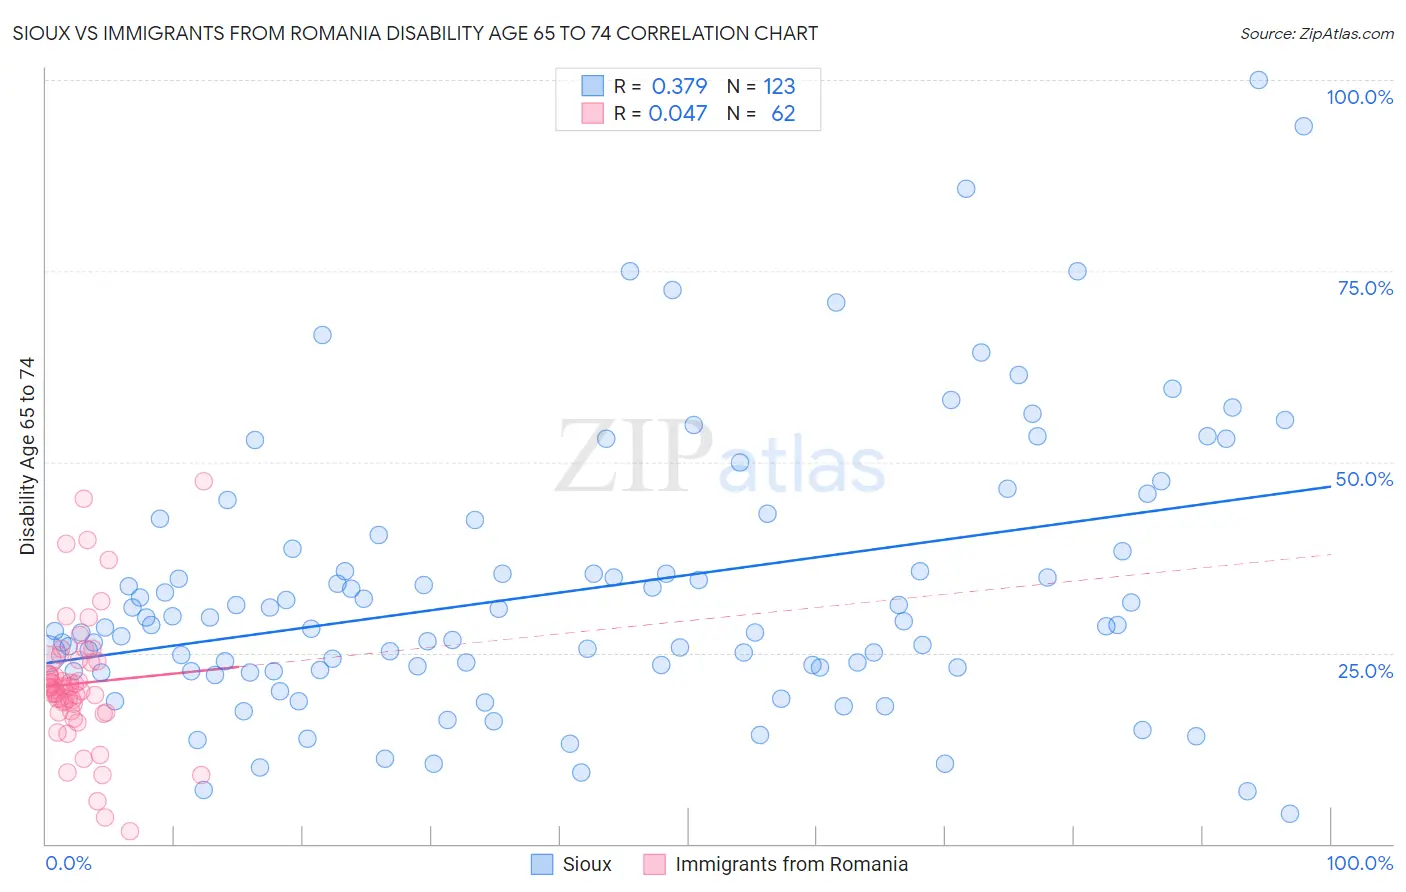
Sioux vs Immigrants from Romania Disability Age 65 to 74 Correlation Chart
The statistical analysis conducted on geographies consisting of 233,824,340 people shows a mild positive correlation between the proportion of Sioux and percentage of population with a disability between the ages 65 and 75 in the United States with a correlation coefficient (R) of 0.379 and weighted average of 27.3%. Similarly, the statistical analysis conducted on geographies consisting of 256,818,588 people shows no correlation between the proportion of Immigrants from Romania and percentage of population with a disability between the ages 65 and 75 in the United States with a correlation coefficient (R) of 0.047 and weighted average of 21.5%, a difference of 27.1%.
Disability Age 65 to 74 Correlation Summary
| Measurement | Sioux | Immigrants from Romania |
| Minimum | 4.0% | 1.7% |
| Maximum | 100.0% | 47.5% |
| Range | 96.0% | 45.9% |
| Mean | 33.2% | 21.0% |
| Median | 28.6% | 20.4% |
| Interquartile 25% (IQ1) | 22.8% | 17.3% |
| Interquartile 75% (IQ3) | 38.6% | 23.9% |
| Interquartile Range (IQR) | 15.9% | 6.6% |
| Standard Deviation (Sample) | 17.9% | 8.5% |
| Standard Deviation (Population) | 17.8% | 8.5% |
Similar Demographics by Disability Age 65 to 74
Demographics Similar to Sioux by Disability Age 65 to 74
In terms of disability age 65 to 74, the demographic groups most similar to Sioux are Yaqui (27.4%, a difference of 0.060%), Shoshone (27.4%, a difference of 0.11%), Ute (27.3%, a difference of 0.15%), Black/African American (27.3%, a difference of 0.21%), and Menominee (27.4%, a difference of 0.34%).
| Demographics | Rating | Rank | Disability Age 65 to 74 |
| Immigrants | Mexico | 0.0 /100 | #301 | Tragic 27.1% |
| Central American Indians | 0.0 /100 | #302 | Tragic 27.1% |
| Tlingit-Haida | 0.0 /100 | #303 | Tragic 27.1% |
| Puget Sound Salish | 0.0 /100 | #304 | Tragic 27.2% |
| Mexicans | 0.0 /100 | #305 | Tragic 27.2% |
| Blacks/African Americans | 0.0 /100 | #306 | Tragic 27.3% |
| Ute | 0.0 /100 | #307 | Tragic 27.3% |
| Sioux | 0.0 /100 | #308 | Tragic 27.3% |
| Yaqui | 0.0 /100 | #309 | Tragic 27.4% |
| Shoshone | 0.0 /100 | #310 | Tragic 27.4% |
| Menominee | 0.0 /100 | #311 | Tragic 27.4% |
| Osage | 0.0 /100 | #312 | Tragic 27.5% |
| Paiute | 0.0 /100 | #313 | Tragic 27.8% |
| Chippewa | 0.0 /100 | #314 | Tragic 27.8% |
| Cajuns | 0.0 /100 | #315 | Tragic 27.9% |
Demographics Similar to Immigrants from Romania by Disability Age 65 to 74
In terms of disability age 65 to 74, the demographic groups most similar to Immigrants from Romania are Immigrants from Denmark (21.5%, a difference of 0.020%), Immigrants from Italy (21.5%, a difference of 0.080%), Immigrants from France (21.5%, a difference of 0.090%), Bhutanese (21.5%, a difference of 0.090%), and Immigrants from Asia (21.5%, a difference of 0.12%).
| Demographics | Rating | Rank | Disability Age 65 to 74 |
| Lithuanians | 99.7 /100 | #48 | Exceptional 21.4% |
| Luxembourgers | 99.7 /100 | #49 | Exceptional 21.4% |
| Immigrants | Malaysia | 99.7 /100 | #50 | Exceptional 21.4% |
| Immigrants | Serbia | 99.6 /100 | #51 | Exceptional 21.4% |
| Immigrants | France | 99.6 /100 | #52 | Exceptional 21.5% |
| Bhutanese | 99.6 /100 | #53 | Exceptional 21.5% |
| Immigrants | Italy | 99.6 /100 | #54 | Exceptional 21.5% |
| Immigrants | Romania | 99.5 /100 | #55 | Exceptional 21.5% |
| Immigrants | Denmark | 99.5 /100 | #56 | Exceptional 21.5% |
| Immigrants | Asia | 99.5 /100 | #57 | Exceptional 21.5% |
| Immigrants | Pakistan | 99.5 /100 | #58 | Exceptional 21.5% |
| Zimbabweans | 99.5 /100 | #59 | Exceptional 21.5% |
| Immigrants | North Macedonia | 99.5 /100 | #60 | Exceptional 21.6% |
| Egyptians | 99.5 /100 | #61 | Exceptional 21.6% |
| Carpatho Rusyns | 99.5 /100 | #62 | Exceptional 21.6% |