Burmese vs Yuman Disability Age 35 to 64
COMPARE
Burmese
Yuman
Disability Age 35 to 64
Disability Age 35 to 64 Comparison
Burmese
Yuman
9.2%
DISABILITY AGE 35 TO 64
100.0/ 100
METRIC RATING
17th/ 347
METRIC RANK
15.8%
DISABILITY AGE 35 TO 64
0.0/ 100
METRIC RATING
333rd/ 347
METRIC RANK
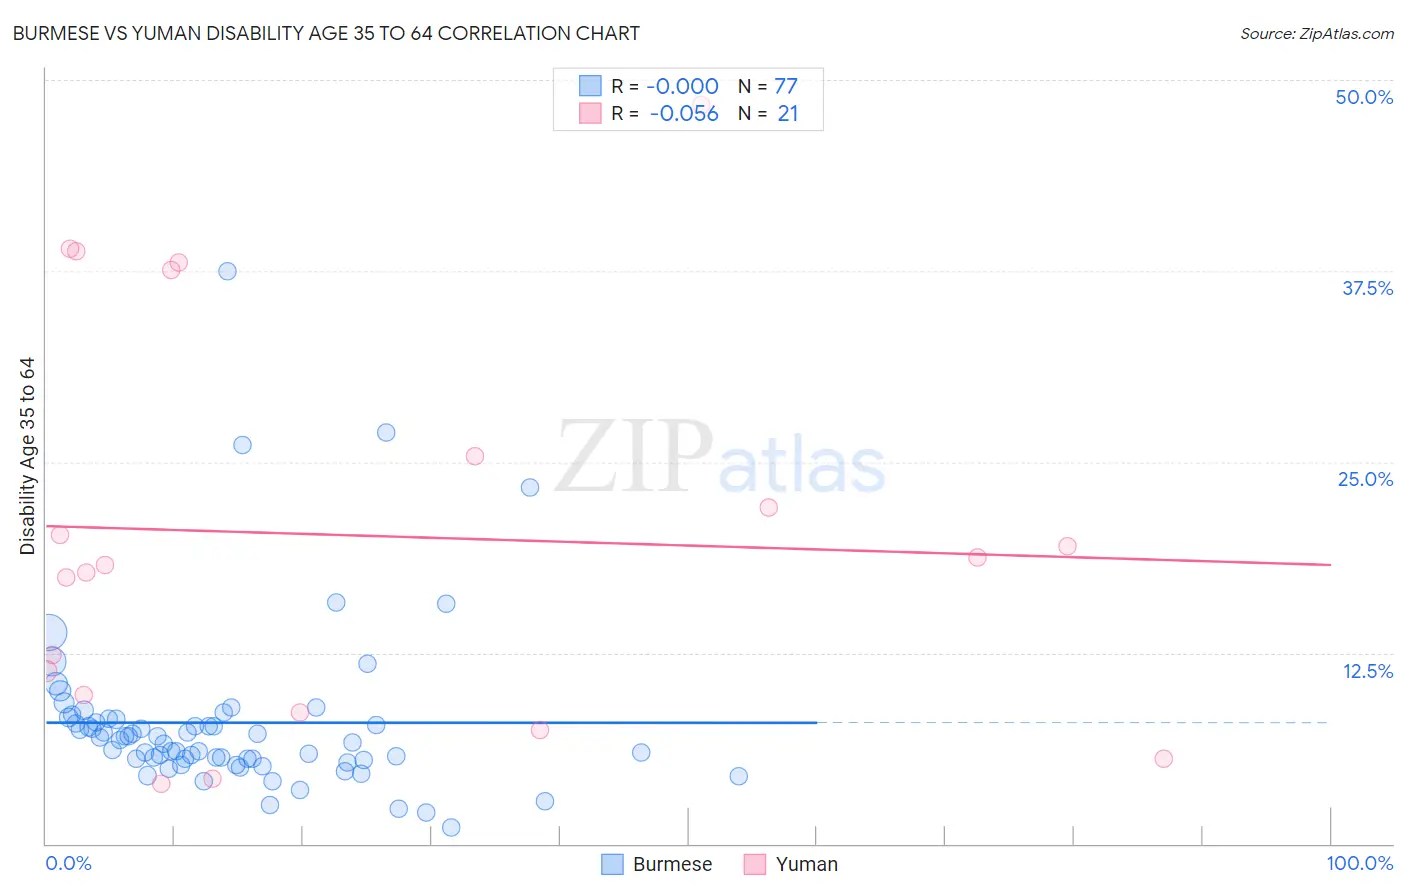
Burmese vs Yuman Disability Age 35 to 64 Correlation Chart
The statistical analysis conducted on geographies consisting of 464,803,120 people shows no correlation between the proportion of Burmese and percentage of population with a disability between the ages 34 and 64 in the United States with a correlation coefficient (R) of -0.000 and weighted average of 9.2%. Similarly, the statistical analysis conducted on geographies consisting of 40,663,205 people shows a slight negative correlation between the proportion of Yuman and percentage of population with a disability between the ages 34 and 64 in the United States with a correlation coefficient (R) of -0.056 and weighted average of 15.8%, a difference of 71.6%.
Disability Age 35 to 64 Correlation Summary
| Measurement | Burmese | Yuman |
| Minimum | 1.0% | 3.9% |
| Maximum | 37.5% | 48.4% |
| Range | 36.5% | 44.5% |
| Mean | 7.9% | 20.2% |
| Median | 6.8% | 18.2% |
| Interquartile 25% (IQ1) | 5.5% | 9.2% |
| Interquartile 75% (IQ3) | 8.2% | 31.5% |
| Interquartile Range (IQR) | 2.6% | 22.3% |
| Standard Deviation (Sample) | 5.6% | 13.1% |
| Standard Deviation (Population) | 5.6% | 12.8% |
Similar Demographics by Disability Age 35 to 64
Demographics Similar to Burmese by Disability Age 35 to 64
In terms of disability age 35 to 64, the demographic groups most similar to Burmese are Soviet Union (9.2%, a difference of 0.41%), Immigrants from Venezuela (9.3%, a difference of 0.65%), Immigrants from Argentina (9.3%, a difference of 1.2%), Okinawan (9.4%, a difference of 1.6%), and Cypriot (9.4%, a difference of 1.6%).
| Demographics | Rating | Rank | Disability Age 35 to 64 |
| Immigrants | Bolivia | 100.0 /100 | #10 | Exceptional 8.7% |
| Immigrants | Eastern Asia | 100.0 /100 | #11 | Exceptional 8.8% |
| Indians (Asian) | 100.0 /100 | #12 | Exceptional 8.9% |
| Immigrants | South Central Asia | 100.0 /100 | #13 | Exceptional 8.9% |
| Immigrants | Singapore | 100.0 /100 | #14 | Exceptional 8.9% |
| Bolivians | 100.0 /100 | #15 | Exceptional 8.9% |
| Immigrants | Korea | 100.0 /100 | #16 | Exceptional 9.0% |
| Burmese | 100.0 /100 | #17 | Exceptional 9.2% |
| Soviet Union | 100.0 /100 | #18 | Exceptional 9.2% |
| Immigrants | Venezuela | 100.0 /100 | #19 | Exceptional 9.3% |
| Immigrants | Argentina | 100.0 /100 | #20 | Exceptional 9.3% |
| Okinawans | 100.0 /100 | #21 | Exceptional 9.4% |
| Cypriots | 100.0 /100 | #22 | Exceptional 9.4% |
| Argentineans | 100.0 /100 | #23 | Exceptional 9.4% |
| Asians | 100.0 /100 | #24 | Exceptional 9.4% |
Demographics Similar to Yuman by Disability Age 35 to 64
In terms of disability age 35 to 64, the demographic groups most similar to Yuman are Colville (15.8%, a difference of 0.19%), Seminole (15.9%, a difference of 0.30%), Menominee (15.9%, a difference of 0.53%), Alaskan Athabascan (15.7%, a difference of 0.55%), and Puerto Rican (15.9%, a difference of 0.85%).
| Demographics | Rating | Rank | Disability Age 35 to 64 |
| Natives/Alaskans | 0.0 /100 | #326 | Tragic 15.3% |
| Pueblo | 0.0 /100 | #327 | Tragic 15.3% |
| Cajuns | 0.0 /100 | #328 | Tragic 15.3% |
| Cherokee | 0.0 /100 | #329 | Tragic 15.5% |
| Navajo | 0.0 /100 | #330 | Tragic 15.5% |
| Dutch West Indians | 0.0 /100 | #331 | Tragic 15.6% |
| Alaskan Athabascans | 0.0 /100 | #332 | Tragic 15.7% |
| Yuman | 0.0 /100 | #333 | Tragic 15.8% |
| Colville | 0.0 /100 | #334 | Tragic 15.8% |
| Seminole | 0.0 /100 | #335 | Tragic 15.9% |
| Menominee | 0.0 /100 | #336 | Tragic 15.9% |
| Puerto Ricans | 0.0 /100 | #337 | Tragic 15.9% |
| Chickasaw | 0.0 /100 | #338 | Tragic 16.1% |
| Pima | 0.0 /100 | #339 | Tragic 16.1% |
| Choctaw | 0.0 /100 | #340 | Tragic 16.4% |