Senegalese vs Alaskan Athabascan Disability Age 35 to 64
COMPARE
Senegalese
Alaskan Athabascan
Disability Age 35 to 64
Disability Age 35 to 64 Comparison
Senegalese
Alaskan Athabascans
12.5%
DISABILITY AGE 35 TO 64
0.5/ 100
METRIC RATING
262nd/ 347
METRIC RANK
15.7%
DISABILITY AGE 35 TO 64
0.0/ 100
METRIC RATING
332nd/ 347
METRIC RANK
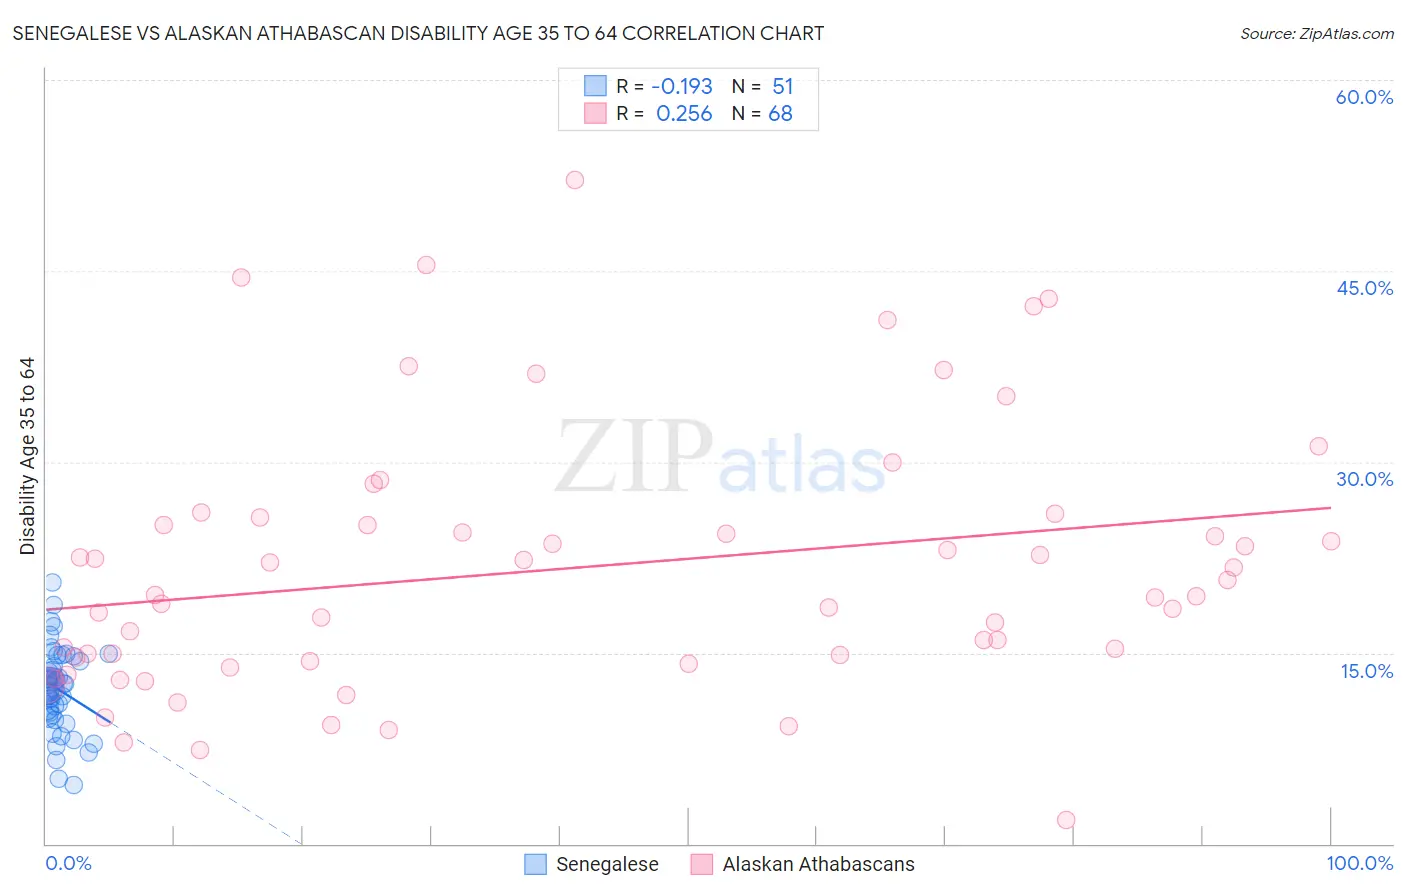
Senegalese vs Alaskan Athabascan Disability Age 35 to 64 Correlation Chart
The statistical analysis conducted on geographies consisting of 78,098,003 people shows a poor negative correlation between the proportion of Senegalese and percentage of population with a disability between the ages 34 and 64 in the United States with a correlation coefficient (R) of -0.193 and weighted average of 12.5%. Similarly, the statistical analysis conducted on geographies consisting of 45,816,251 people shows a weak positive correlation between the proportion of Alaskan Athabascans and percentage of population with a disability between the ages 34 and 64 in the United States with a correlation coefficient (R) of 0.256 and weighted average of 15.7%, a difference of 25.9%.
Disability Age 35 to 64 Correlation Summary
| Measurement | Senegalese | Alaskan Athabascan |
| Minimum | 4.6% | 1.9% |
| Maximum | 20.5% | 52.2% |
| Range | 15.9% | 50.3% |
| Mean | 12.1% | 21.7% |
| Median | 12.5% | 19.5% |
| Interquartile 25% (IQ1) | 10.1% | 14.5% |
| Interquartile 75% (IQ3) | 14.3% | 25.4% |
| Interquartile Range (IQR) | 4.2% | 10.9% |
| Standard Deviation (Sample) | 3.3% | 10.3% |
| Standard Deviation (Population) | 3.2% | 10.3% |
Similar Demographics by Disability Age 35 to 64
Demographics Similar to Senegalese by Disability Age 35 to 64
In terms of disability age 35 to 64, the demographic groups most similar to Senegalese are Malaysian (12.5%, a difference of 0.080%), German Russian (12.5%, a difference of 0.23%), Immigrants from Zaire (12.5%, a difference of 0.25%), Immigrants from Portugal (12.5%, a difference of 0.26%), and Marshallese (12.5%, a difference of 0.37%).
| Demographics | Rating | Rank | Disability Age 35 to 64 |
| Japanese | 0.8 /100 | #255 | Tragic 12.3% |
| Scottish | 0.8 /100 | #256 | Tragic 12.4% |
| Mexicans | 0.7 /100 | #257 | Tragic 12.4% |
| Welsh | 0.6 /100 | #258 | Tragic 12.4% |
| English | 0.6 /100 | #259 | Tragic 12.4% |
| German Russians | 0.5 /100 | #260 | Tragic 12.5% |
| Malaysians | 0.5 /100 | #261 | Tragic 12.5% |
| Senegalese | 0.5 /100 | #262 | Tragic 12.5% |
| Immigrants | Zaire | 0.4 /100 | #263 | Tragic 12.5% |
| Immigrants | Portugal | 0.4 /100 | #264 | Tragic 12.5% |
| Marshallese | 0.4 /100 | #265 | Tragic 12.5% |
| Whites/Caucasians | 0.3 /100 | #266 | Tragic 12.6% |
| Sub-Saharan Africans | 0.2 /100 | #267 | Tragic 12.6% |
| Immigrants | Dominica | 0.2 /100 | #268 | Tragic 12.7% |
| Spanish | 0.2 /100 | #269 | Tragic 12.7% |
Demographics Similar to Alaskan Athabascans by Disability Age 35 to 64
In terms of disability age 35 to 64, the demographic groups most similar to Alaskan Athabascans are Yuman (15.8%, a difference of 0.55%), Dutch West Indian (15.6%, a difference of 0.59%), Colville (15.8%, a difference of 0.75%), Seminole (15.9%, a difference of 0.85%), and Menominee (15.9%, a difference of 1.1%).
| Demographics | Rating | Rank | Disability Age 35 to 64 |
| Arapaho | 0.0 /100 | #325 | Tragic 15.1% |
| Natives/Alaskans | 0.0 /100 | #326 | Tragic 15.3% |
| Pueblo | 0.0 /100 | #327 | Tragic 15.3% |
| Cajuns | 0.0 /100 | #328 | Tragic 15.3% |
| Cherokee | 0.0 /100 | #329 | Tragic 15.5% |
| Navajo | 0.0 /100 | #330 | Tragic 15.5% |
| Dutch West Indians | 0.0 /100 | #331 | Tragic 15.6% |
| Alaskan Athabascans | 0.0 /100 | #332 | Tragic 15.7% |
| Yuman | 0.0 /100 | #333 | Tragic 15.8% |
| Colville | 0.0 /100 | #334 | Tragic 15.8% |
| Seminole | 0.0 /100 | #335 | Tragic 15.9% |
| Menominee | 0.0 /100 | #336 | Tragic 15.9% |
| Puerto Ricans | 0.0 /100 | #337 | Tragic 15.9% |
| Chickasaw | 0.0 /100 | #338 | Tragic 16.1% |
| Pima | 0.0 /100 | #339 | Tragic 16.1% |