Lebanese vs Alaskan Athabascan Disability Age 35 to 64
COMPARE
Lebanese
Alaskan Athabascan
Disability Age 35 to 64
Disability Age 35 to 64 Comparison
Lebanese
Alaskan Athabascans
11.3%
DISABILITY AGE 35 TO 64
51.8/ 100
METRIC RATING
173rd/ 347
METRIC RANK
15.7%
DISABILITY AGE 35 TO 64
0.0/ 100
METRIC RATING
332nd/ 347
METRIC RANK
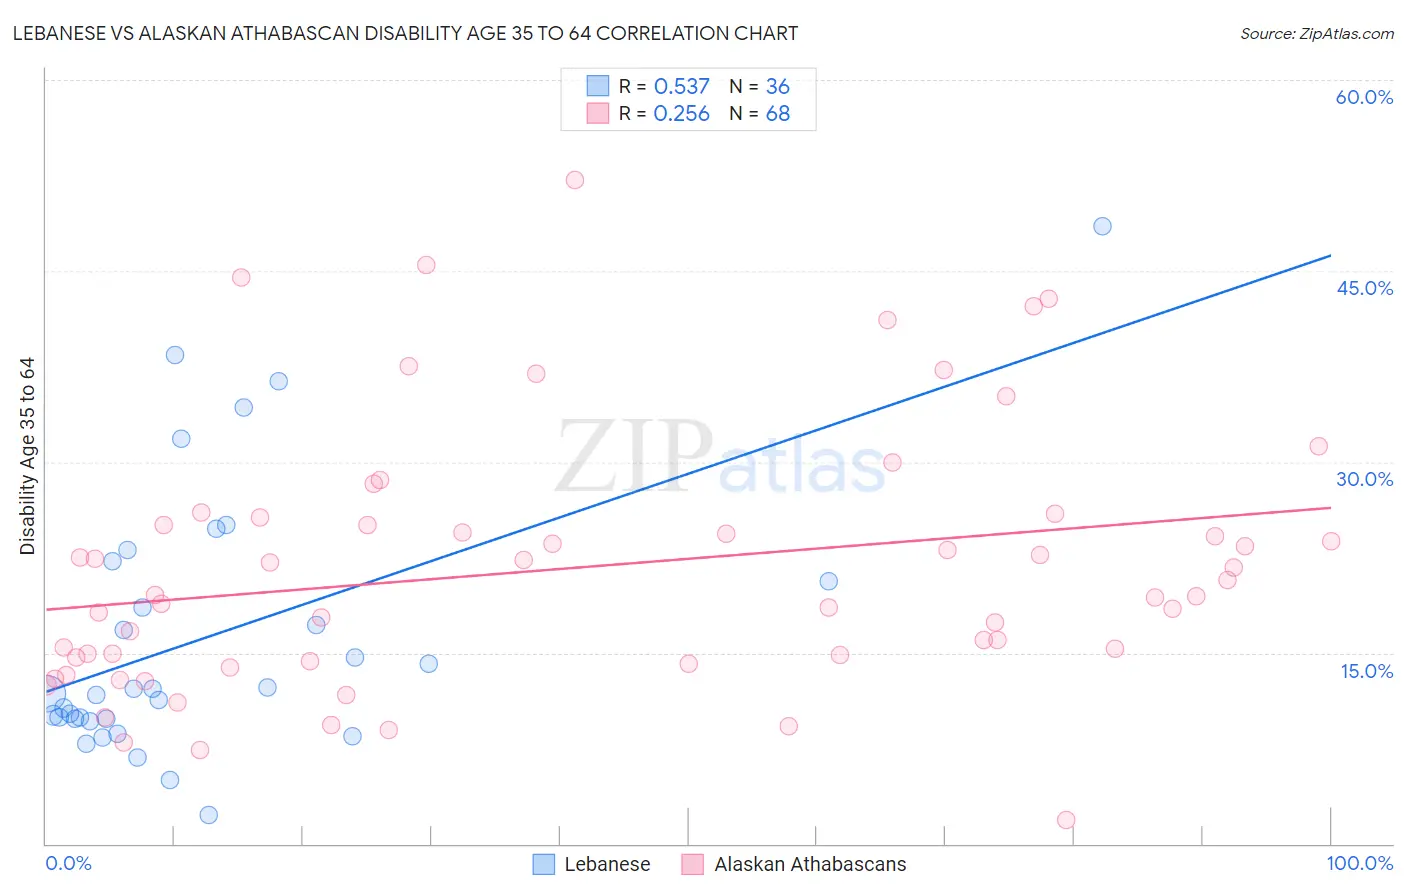
Lebanese vs Alaskan Athabascan Disability Age 35 to 64 Correlation Chart
The statistical analysis conducted on geographies consisting of 401,283,534 people shows a substantial positive correlation between the proportion of Lebanese and percentage of population with a disability between the ages 34 and 64 in the United States with a correlation coefficient (R) of 0.537 and weighted average of 11.3%. Similarly, the statistical analysis conducted on geographies consisting of 45,816,251 people shows a weak positive correlation between the proportion of Alaskan Athabascans and percentage of population with a disability between the ages 34 and 64 in the United States with a correlation coefficient (R) of 0.256 and weighted average of 15.7%, a difference of 39.7%.
Disability Age 35 to 64 Correlation Summary
| Measurement | Lebanese | Alaskan Athabascan |
| Minimum | 2.2% | 1.9% |
| Maximum | 48.5% | 52.2% |
| Range | 46.2% | 50.3% |
| Mean | 16.3% | 21.7% |
| Median | 12.0% | 19.5% |
| Interquartile 25% (IQ1) | 9.8% | 14.5% |
| Interquartile 75% (IQ3) | 21.4% | 25.4% |
| Interquartile Range (IQR) | 11.6% | 10.9% |
| Standard Deviation (Sample) | 10.5% | 10.3% |
| Standard Deviation (Population) | 10.4% | 10.3% |
Similar Demographics by Disability Age 35 to 64
Demographics Similar to Lebanese by Disability Age 35 to 64
In terms of disability age 35 to 64, the demographic groups most similar to Lebanese are Immigrants from Fiji (11.3%, a difference of 0.14%), Italian (11.2%, a difference of 0.31%), Czech (11.3%, a difference of 0.31%), Immigrants from Trinidad and Tobago (11.2%, a difference of 0.34%), and Immigrants from Uganda (11.2%, a difference of 0.51%).
| Demographics | Rating | Rank | Disability Age 35 to 64 |
| Immigrants | Haiti | 63.8 /100 | #166 | Good 11.1% |
| Austrians | 63.2 /100 | #167 | Good 11.1% |
| Central Americans | 59.1 /100 | #168 | Average 11.2% |
| Haitians | 59.0 /100 | #169 | Average 11.2% |
| Immigrants | Uganda | 58.0 /100 | #170 | Average 11.2% |
| Immigrants | Trinidad and Tobago | 55.9 /100 | #171 | Average 11.2% |
| Italians | 55.6 /100 | #172 | Average 11.2% |
| Lebanese | 51.8 /100 | #173 | Average 11.3% |
| Immigrants | Fiji | 50.0 /100 | #174 | Average 11.3% |
| Czechs | 47.9 /100 | #175 | Average 11.3% |
| Ugandans | 43.7 /100 | #176 | Average 11.3% |
| Immigrants | Eastern Africa | 42.2 /100 | #177 | Average 11.3% |
| Poles | 42.0 /100 | #178 | Average 11.3% |
| Immigrants | Barbados | 41.6 /100 | #179 | Average 11.3% |
| Immigrants | Caribbean | 41.5 /100 | #180 | Average 11.3% |
Demographics Similar to Alaskan Athabascans by Disability Age 35 to 64
In terms of disability age 35 to 64, the demographic groups most similar to Alaskan Athabascans are Yuman (15.8%, a difference of 0.55%), Dutch West Indian (15.6%, a difference of 0.59%), Colville (15.8%, a difference of 0.75%), Seminole (15.9%, a difference of 0.85%), and Menominee (15.9%, a difference of 1.1%).
| Demographics | Rating | Rank | Disability Age 35 to 64 |
| Arapaho | 0.0 /100 | #325 | Tragic 15.1% |
| Natives/Alaskans | 0.0 /100 | #326 | Tragic 15.3% |
| Pueblo | 0.0 /100 | #327 | Tragic 15.3% |
| Cajuns | 0.0 /100 | #328 | Tragic 15.3% |
| Cherokee | 0.0 /100 | #329 | Tragic 15.5% |
| Navajo | 0.0 /100 | #330 | Tragic 15.5% |
| Dutch West Indians | 0.0 /100 | #331 | Tragic 15.6% |
| Alaskan Athabascans | 0.0 /100 | #332 | Tragic 15.7% |
| Yuman | 0.0 /100 | #333 | Tragic 15.8% |
| Colville | 0.0 /100 | #334 | Tragic 15.8% |
| Seminole | 0.0 /100 | #335 | Tragic 15.9% |
| Menominee | 0.0 /100 | #336 | Tragic 15.9% |
| Puerto Ricans | 0.0 /100 | #337 | Tragic 15.9% |
| Chickasaw | 0.0 /100 | #338 | Tragic 16.1% |
| Pima | 0.0 /100 | #339 | Tragic 16.1% |