Scottish vs French American Indian Disability Age 65 to 74
COMPARE
Scottish
French American Indian
Disability Age 65 to 74
Disability Age 65 to 74 Comparison
Scottish
French American Indians
23.6%
DISABILITY AGE 65 TO 74
33.1/ 100
METRIC RATING
189th/ 347
METRIC RANK
25.8%
DISABILITY AGE 65 TO 74
0.1/ 100
METRIC RATING
276th/ 347
METRIC RANK
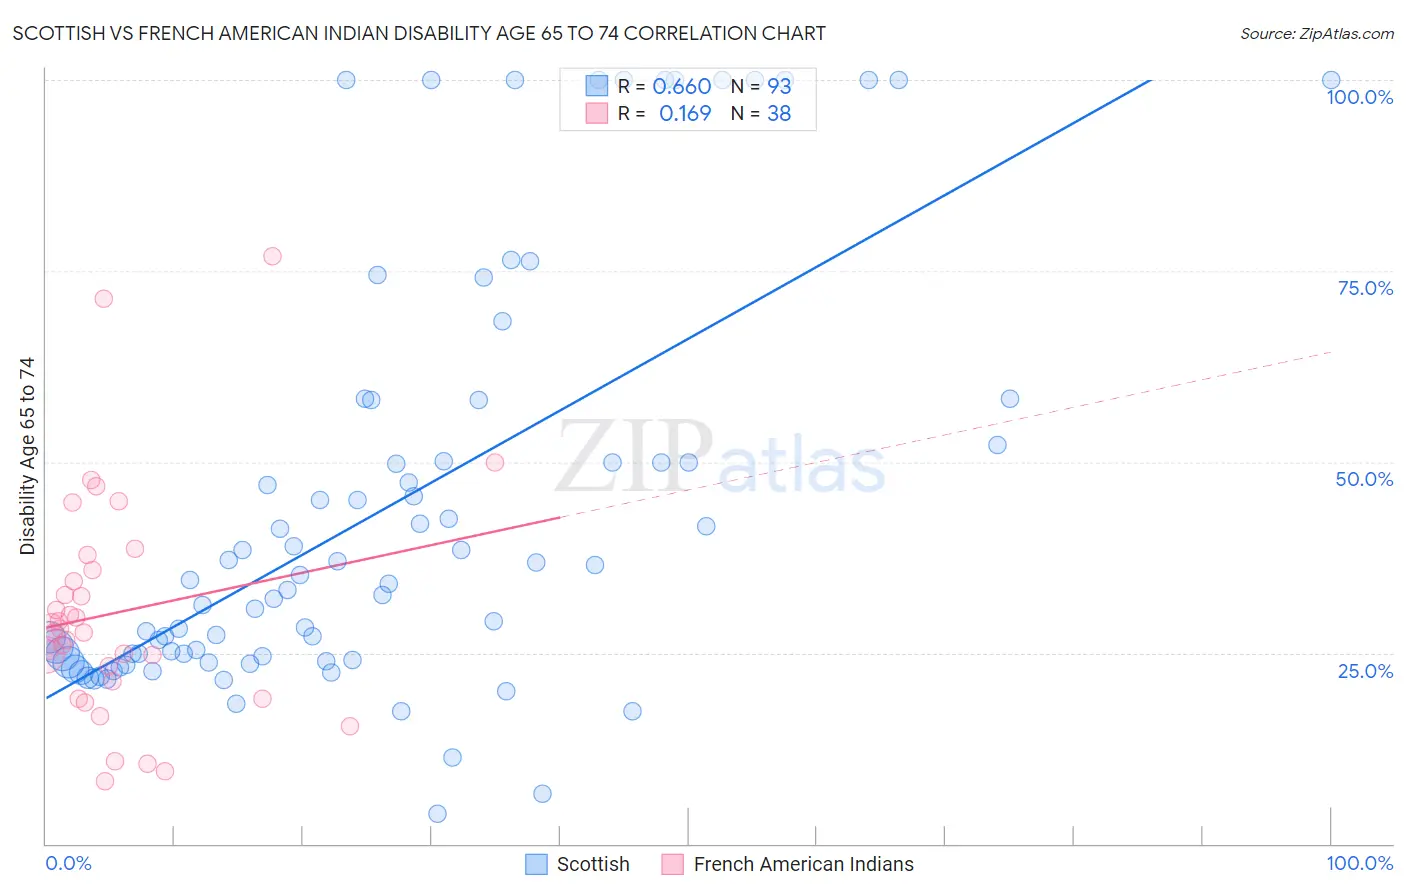
Scottish vs French American Indian Disability Age 65 to 74 Correlation Chart
The statistical analysis conducted on geographies consisting of 564,724,008 people shows a significant positive correlation between the proportion of Scottish and percentage of population with a disability between the ages 65 and 75 in the United States with a correlation coefficient (R) of 0.660 and weighted average of 23.6%. Similarly, the statistical analysis conducted on geographies consisting of 131,943,137 people shows a poor positive correlation between the proportion of French American Indians and percentage of population with a disability between the ages 65 and 75 in the United States with a correlation coefficient (R) of 0.169 and weighted average of 25.8%, a difference of 9.5%.
Disability Age 65 to 74 Correlation Summary
| Measurement | Scottish | French American Indian |
| Minimum | 4.0% | 8.2% |
| Maximum | 100.0% | 76.9% |
| Range | 96.0% | 68.8% |
| Mean | 43.7% | 30.3% |
| Median | 34.0% | 27.9% |
| Interquartile 25% (IQ1) | 24.0% | 21.2% |
| Interquartile 75% (IQ3) | 51.1% | 35.9% |
| Interquartile Range (IQR) | 27.1% | 14.7% |
| Standard Deviation (Sample) | 27.1% | 14.9% |
| Standard Deviation (Population) | 26.9% | 14.7% |
Similar Demographics by Disability Age 65 to 74
Demographics Similar to Scottish by Disability Age 65 to 74
In terms of disability age 65 to 74, the demographic groups most similar to Scottish are Immigrants from Cuba (23.6%, a difference of 0.060%), Immigrants from Guyana (23.6%, a difference of 0.12%), Immigrants from Bangladesh (23.6%, a difference of 0.19%), Ecuadorian (23.6%, a difference of 0.23%), and Portuguese (23.5%, a difference of 0.30%).
| Demographics | Rating | Rank | Disability Age 65 to 74 |
| Irish | 44.4 /100 | #182 | Average 23.4% |
| Immigrants | Eastern Africa | 42.8 /100 | #183 | Average 23.4% |
| Immigrants | Germany | 42.5 /100 | #184 | Average 23.4% |
| Haitians | 42.4 /100 | #185 | Average 23.4% |
| Basques | 38.4 /100 | #186 | Fair 23.5% |
| Portuguese | 37.8 /100 | #187 | Fair 23.5% |
| Immigrants | Cuba | 34.0 /100 | #188 | Fair 23.6% |
| Scottish | 33.1 /100 | #189 | Fair 23.6% |
| Immigrants | Guyana | 31.2 /100 | #190 | Fair 23.6% |
| Immigrants | Bangladesh | 30.2 /100 | #191 | Fair 23.6% |
| Ecuadorians | 29.7 /100 | #192 | Fair 23.6% |
| English | 28.5 /100 | #193 | Fair 23.6% |
| Sudanese | 27.8 /100 | #194 | Fair 23.7% |
| Immigrants | St. Vincent and the Grenadines | 26.1 /100 | #195 | Fair 23.7% |
| Immigrants | Trinidad and Tobago | 26.1 /100 | #196 | Fair 23.7% |
Demographics Similar to French American Indians by Disability Age 65 to 74
In terms of disability age 65 to 74, the demographic groups most similar to French American Indians are Honduran (25.8%, a difference of 0.010%), American (25.8%, a difference of 0.020%), Belizean (25.8%, a difference of 0.090%), Immigrants from Belize (25.8%, a difference of 0.11%), and U.S. Virgin Islander (25.9%, a difference of 0.19%).
| Demographics | Rating | Rank | Disability Age 65 to 74 |
| Hmong | 0.1 /100 | #269 | Tragic 25.7% |
| Immigrants | Guatemala | 0.1 /100 | #270 | Tragic 25.7% |
| Immigrants | Liberia | 0.1 /100 | #271 | Tragic 25.7% |
| Immigrants | Dominica | 0.1 /100 | #272 | Tragic 25.7% |
| Japanese | 0.1 /100 | #273 | Tragic 25.7% |
| Americans | 0.1 /100 | #274 | Tragic 25.8% |
| Hondurans | 0.1 /100 | #275 | Tragic 25.8% |
| French American Indians | 0.1 /100 | #276 | Tragic 25.8% |
| Belizeans | 0.1 /100 | #277 | Tragic 25.8% |
| Immigrants | Belize | 0.1 /100 | #278 | Tragic 25.8% |
| U.S. Virgin Islanders | 0.1 /100 | #279 | Tragic 25.9% |
| Cree | 0.1 /100 | #280 | Tragic 25.9% |
| Immigrants | Honduras | 0.1 /100 | #281 | Tragic 25.9% |
| Delaware | 0.1 /100 | #282 | Tragic 25.9% |
| Spanish Americans | 0.0 /100 | #283 | Tragic 25.9% |