Scottish vs Pennsylvania German Disability Age 65 to 74
COMPARE
Scottish
Pennsylvania German
Disability Age 65 to 74
Disability Age 65 to 74 Comparison
Scottish
Pennsylvania Germans
23.6%
DISABILITY AGE 65 TO 74
33.1/ 100
METRIC RATING
189th/ 347
METRIC RANK
24.0%
DISABILITY AGE 65 TO 74
13.3/ 100
METRIC RATING
215th/ 347
METRIC RANK
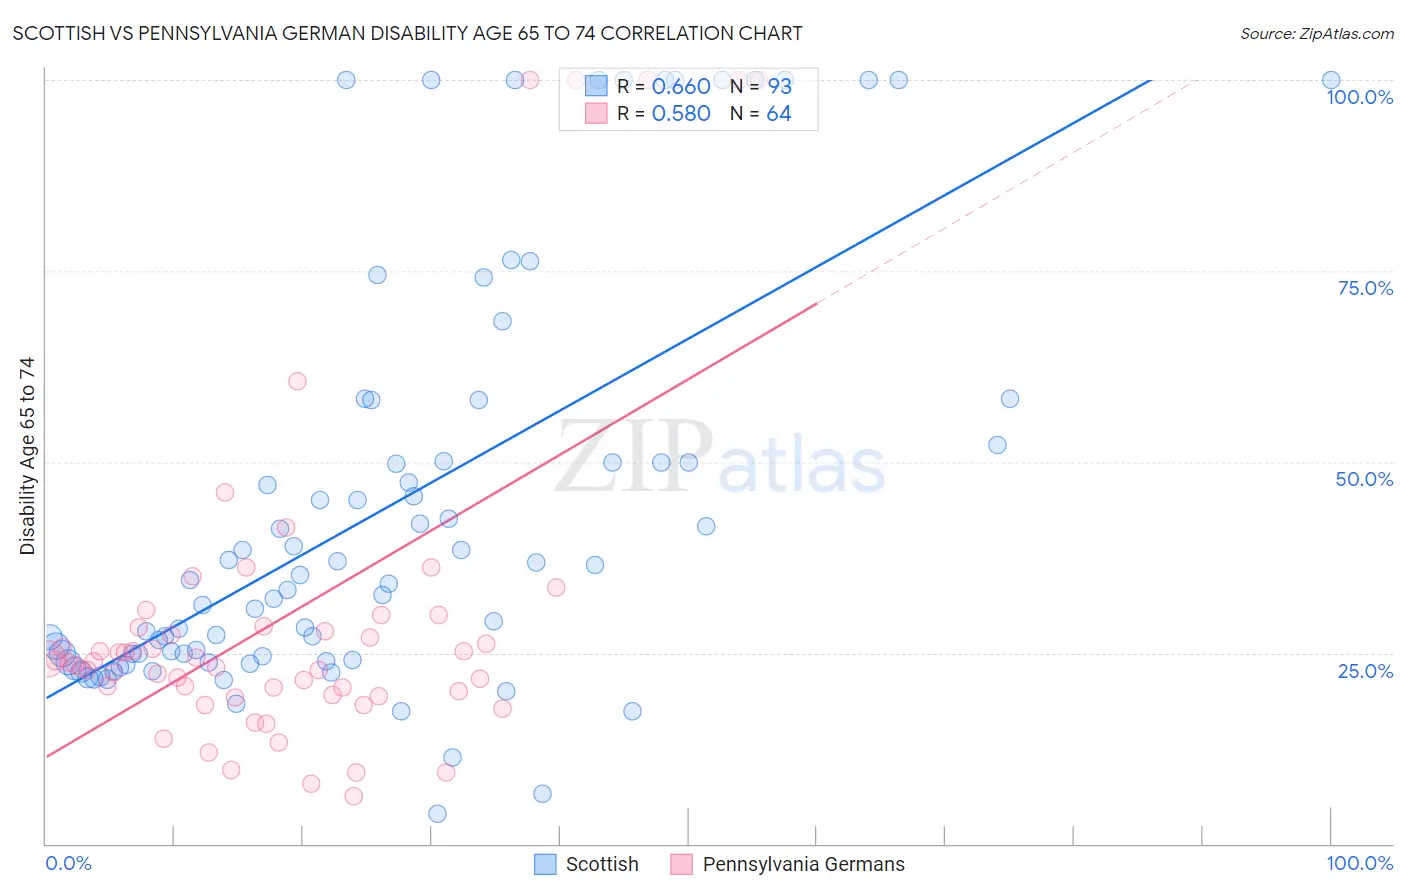
Scottish vs Pennsylvania German Disability Age 65 to 74 Correlation Chart
The statistical analysis conducted on geographies consisting of 564,724,008 people shows a significant positive correlation between the proportion of Scottish and percentage of population with a disability between the ages 65 and 75 in the United States with a correlation coefficient (R) of 0.660 and weighted average of 23.6%. Similarly, the statistical analysis conducted on geographies consisting of 233,928,822 people shows a substantial positive correlation between the proportion of Pennsylvania Germans and percentage of population with a disability between the ages 65 and 75 in the United States with a correlation coefficient (R) of 0.580 and weighted average of 24.0%, a difference of 1.7%.
Disability Age 65 to 74 Correlation Summary
| Measurement | Scottish | Pennsylvania German |
| Minimum | 4.0% | 6.3% |
| Maximum | 100.0% | 100.0% |
| Range | 96.0% | 93.7% |
| Mean | 43.7% | 29.6% |
| Median | 34.0% | 23.8% |
| Interquartile 25% (IQ1) | 24.0% | 19.7% |
| Interquartile 75% (IQ3) | 51.1% | 28.4% |
| Interquartile Range (IQR) | 27.1% | 8.6% |
| Standard Deviation (Sample) | 27.1% | 22.4% |
| Standard Deviation (Population) | 26.9% | 22.3% |
Similar Demographics by Disability Age 65 to 74
Demographics Similar to Scottish by Disability Age 65 to 74
In terms of disability age 65 to 74, the demographic groups most similar to Scottish are Immigrants from Cuba (23.6%, a difference of 0.060%), Immigrants from Guyana (23.6%, a difference of 0.12%), Immigrants from Bangladesh (23.6%, a difference of 0.19%), Ecuadorian (23.6%, a difference of 0.23%), and Portuguese (23.5%, a difference of 0.30%).
| Demographics | Rating | Rank | Disability Age 65 to 74 |
| Irish | 44.4 /100 | #182 | Average 23.4% |
| Immigrants | Eastern Africa | 42.8 /100 | #183 | Average 23.4% |
| Immigrants | Germany | 42.5 /100 | #184 | Average 23.4% |
| Haitians | 42.4 /100 | #185 | Average 23.4% |
| Basques | 38.4 /100 | #186 | Fair 23.5% |
| Portuguese | 37.8 /100 | #187 | Fair 23.5% |
| Immigrants | Cuba | 34.0 /100 | #188 | Fair 23.6% |
| Scottish | 33.1 /100 | #189 | Fair 23.6% |
| Immigrants | Guyana | 31.2 /100 | #190 | Fair 23.6% |
| Immigrants | Bangladesh | 30.2 /100 | #191 | Fair 23.6% |
| Ecuadorians | 29.7 /100 | #192 | Fair 23.6% |
| English | 28.5 /100 | #193 | Fair 23.6% |
| Sudanese | 27.8 /100 | #194 | Fair 23.7% |
| Immigrants | St. Vincent and the Grenadines | 26.1 /100 | #195 | Fair 23.7% |
| Immigrants | Trinidad and Tobago | 26.1 /100 | #196 | Fair 23.7% |
Demographics Similar to Pennsylvania Germans by Disability Age 65 to 74
In terms of disability age 65 to 74, the demographic groups most similar to Pennsylvania Germans are Immigrants from Oceania (24.0%, a difference of 0.040%), Nicaraguan (23.9%, a difference of 0.12%), Jamaican (24.0%, a difference of 0.13%), Immigrants from Portugal (24.0%, a difference of 0.20%), and Immigrants from Nigeria (24.0%, a difference of 0.20%).
| Demographics | Rating | Rank | Disability Age 65 to 74 |
| Immigrants | Barbados | 19.6 /100 | #208 | Poor 23.8% |
| Immigrants | Kenya | 19.6 /100 | #209 | Poor 23.8% |
| Trinidadians and Tobagonians | 16.4 /100 | #210 | Poor 23.9% |
| Immigrants | West Indies | 15.9 /100 | #211 | Poor 23.9% |
| French | 15.7 /100 | #212 | Poor 23.9% |
| Nicaraguans | 14.3 /100 | #213 | Poor 23.9% |
| Immigrants | Oceania | 13.6 /100 | #214 | Poor 24.0% |
| Pennsylvania Germans | 13.3 /100 | #215 | Poor 24.0% |
| Jamaicans | 12.2 /100 | #216 | Poor 24.0% |
| Immigrants | Portugal | 11.7 /100 | #217 | Poor 24.0% |
| Immigrants | Nigeria | 11.7 /100 | #218 | Poor 24.0% |
| Immigrants | Burma/Myanmar | 11.6 /100 | #219 | Poor 24.0% |
| Ghanaians | 10.4 /100 | #220 | Poor 24.1% |
| Immigrants | Nicaragua | 9.8 /100 | #221 | Tragic 24.1% |
| Native Hawaiians | 9.3 /100 | #222 | Tragic 24.1% |