Scottish vs Immigrants from Jamaica Unemployment Among Ages 25 to 29 years
COMPARE
Scottish
Immigrants from Jamaica
Unemployment Among Ages 25 to 29 years
Unemployment Among Ages 25 to 29 years Comparison
Scottish
Immigrants from Jamaica
6.6%
UNEMPLOYMENT AMONG AGES 25 TO 29 YEARS
60.7/ 100
METRIC RATING
160th/ 347
METRIC RANK
8.1%
UNEMPLOYMENT AMONG AGES 25 TO 29 YEARS
0.0/ 100
METRIC RATING
308th/ 347
METRIC RANK
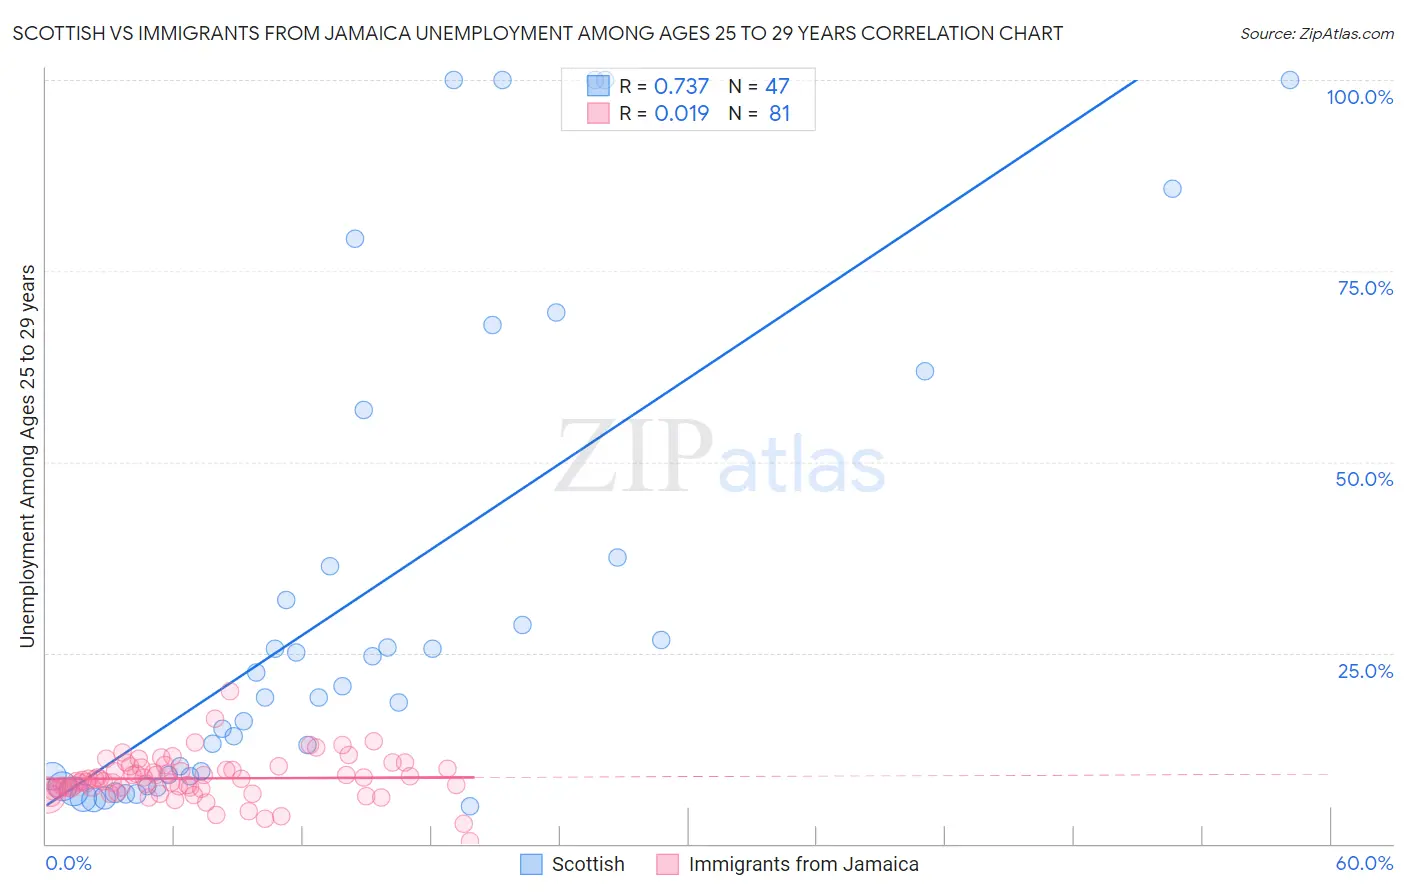
Scottish vs Immigrants from Jamaica Unemployment Among Ages 25 to 29 years Correlation Chart
The statistical analysis conducted on geographies consisting of 502,652,596 people shows a strong positive correlation between the proportion of Scottish and unemployment rate among population between the ages 25 and 29 in the United States with a correlation coefficient (R) of 0.737 and weighted average of 6.6%. Similarly, the statistical analysis conducted on geographies consisting of 291,433,055 people shows no correlation between the proportion of Immigrants from Jamaica and unemployment rate among population between the ages 25 and 29 in the United States with a correlation coefficient (R) of 0.019 and weighted average of 8.1%, a difference of 22.4%.
Unemployment Among Ages 25 to 29 years Correlation Summary
| Measurement | Scottish | Immigrants from Jamaica |
| Minimum | 4.9% | 0.30% |
| Maximum | 100.0% | 20.0% |
| Range | 95.1% | 19.7% |
| Mean | 31.9% | 8.6% |
| Median | 19.2% | 8.3% |
| Interquartile 25% (IQ1) | 8.8% | 7.2% |
| Interquartile 75% (IQ3) | 37.4% | 10.0% |
| Interquartile Range (IQR) | 28.6% | 2.8% |
| Standard Deviation (Sample) | 31.2% | 2.9% |
| Standard Deviation (Population) | 30.9% | 2.9% |
Similar Demographics by Unemployment Among Ages 25 to 29 years
Demographics Similar to Scottish by Unemployment Among Ages 25 to 29 years
In terms of unemployment among ages 25 to 29 years, the demographic groups most similar to Scottish are Paraguayan (6.6%, a difference of 0.020%), Welsh (6.6%, a difference of 0.040%), Immigrants from Czechoslovakia (6.6%, a difference of 0.040%), Immigrants from Russia (6.6%, a difference of 0.050%), and Immigrants from Middle Africa (6.6%, a difference of 0.090%).
| Demographics | Rating | Rank | Unemployment Among Ages 25 to 29 years |
| Immigrants | Italy | 64.4 /100 | #153 | Good 6.6% |
| Colombians | 64.0 /100 | #154 | Good 6.6% |
| Immigrants | Latvia | 63.9 /100 | #155 | Good 6.6% |
| Immigrants | Laos | 63.5 /100 | #156 | Good 6.6% |
| South Africans | 63.5 /100 | #157 | Good 6.6% |
| Immigrants | Russia | 61.5 /100 | #158 | Good 6.6% |
| Welsh | 61.3 /100 | #159 | Good 6.6% |
| Scottish | 60.7 /100 | #160 | Good 6.6% |
| Paraguayans | 60.4 /100 | #161 | Good 6.6% |
| Immigrants | Czechoslovakia | 60.2 /100 | #162 | Good 6.6% |
| Immigrants | Middle Africa | 59.4 /100 | #163 | Average 6.6% |
| Greeks | 58.5 /100 | #164 | Average 6.6% |
| English | 58.0 /100 | #165 | Average 6.6% |
| Immigrants | Northern Europe | 57.3 /100 | #166 | Average 6.6% |
| Immigrants | Canada | 55.0 /100 | #167 | Average 6.6% |
Demographics Similar to Immigrants from Jamaica by Unemployment Among Ages 25 to 29 years
In terms of unemployment among ages 25 to 29 years, the demographic groups most similar to Immigrants from Jamaica are Immigrants from Haiti (8.1%, a difference of 0.010%), U.S. Virgin Islander (8.1%, a difference of 0.020%), Immigrants from the Azores (8.1%, a difference of 0.26%), Immigrants from Barbados (8.0%, a difference of 0.42%), and Haitian (8.0%, a difference of 0.58%).
| Demographics | Rating | Rank | Unemployment Among Ages 25 to 29 years |
| West Indians | 0.0 /100 | #301 | Tragic 7.9% |
| Jamaicans | 0.0 /100 | #302 | Tragic 7.9% |
| Immigrants | Yemen | 0.0 /100 | #303 | Tragic 8.0% |
| Cajuns | 0.0 /100 | #304 | Tragic 8.0% |
| Tsimshian | 0.0 /100 | #305 | Tragic 8.0% |
| Haitians | 0.0 /100 | #306 | Tragic 8.0% |
| Immigrants | Barbados | 0.0 /100 | #307 | Tragic 8.0% |
| Immigrants | Jamaica | 0.0 /100 | #308 | Tragic 8.1% |
| Immigrants | Haiti | 0.0 /100 | #309 | Tragic 8.1% |
| U.S. Virgin Islanders | 0.0 /100 | #310 | Tragic 8.1% |
| Immigrants | Azores | 0.0 /100 | #311 | Tragic 8.1% |
| Dutch West Indians | 0.0 /100 | #312 | Tragic 8.2% |
| Immigrants | St. Vincent and the Grenadines | 0.0 /100 | #313 | Tragic 8.4% |
| Immigrants | Dominica | 0.0 /100 | #314 | Tragic 8.4% |
| British West Indians | 0.0 /100 | #315 | Tragic 8.4% |