Samoan vs Immigrants from Russia Vision Disability
COMPARE
Samoan
Immigrants from Russia
Vision Disability
Vision Disability Comparison
Samoans
Immigrants from Russia
2.2%
VISION DISABILITY
15.7/ 100
METRIC RATING
205th/ 347
METRIC RANK
2.0%
VISION DISABILITY
99.1/ 100
METRIC RATING
62nd/ 347
METRIC RANK
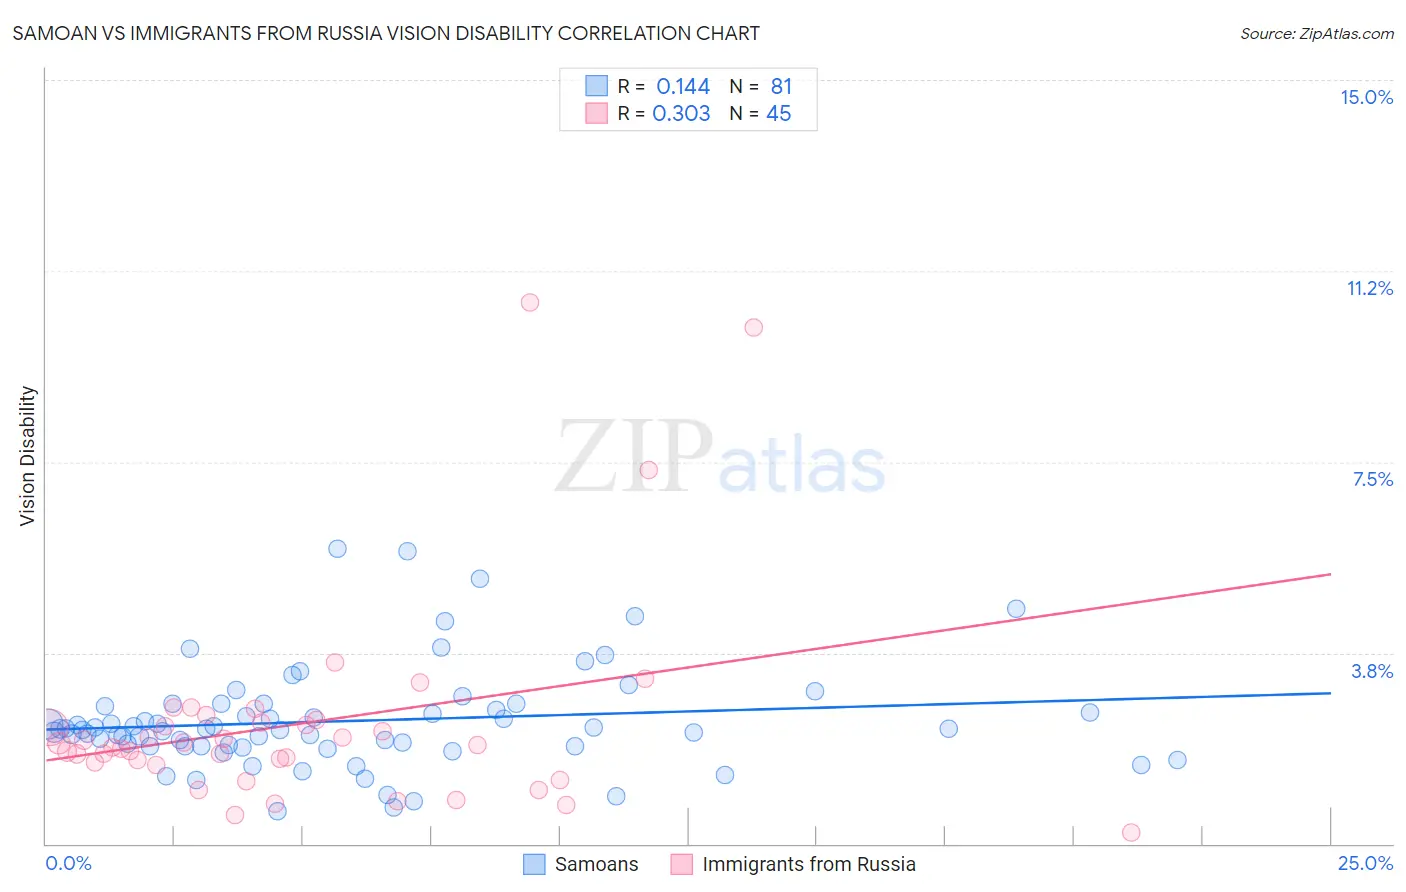
Samoan vs Immigrants from Russia Vision Disability Correlation Chart
The statistical analysis conducted on geographies consisting of 225,065,967 people shows a poor positive correlation between the proportion of Samoans and percentage of population with vision disability in the United States with a correlation coefficient (R) of 0.144 and weighted average of 2.2%. Similarly, the statistical analysis conducted on geographies consisting of 347,675,214 people shows a mild positive correlation between the proportion of Immigrants from Russia and percentage of population with vision disability in the United States with a correlation coefficient (R) of 0.303 and weighted average of 2.0%, a difference of 10.8%.
Vision Disability Correlation Summary
| Measurement | Samoan | Immigrants from Russia |
| Minimum | 0.64% | 0.22% |
| Maximum | 5.8% | 10.6% |
| Range | 5.1% | 10.4% |
| Mean | 2.4% | 2.4% |
| Median | 2.2% | 1.9% |
| Interquartile 25% (IQ1) | 1.9% | 1.6% |
| Interquartile 75% (IQ3) | 2.7% | 2.4% |
| Interquartile Range (IQR) | 0.80% | 0.85% |
| Standard Deviation (Sample) | 1.0% | 2.1% |
| Standard Deviation (Population) | 1.00% | 2.0% |
Similar Demographics by Vision Disability
Demographics Similar to Samoans by Vision Disability
In terms of vision disability, the demographic groups most similar to Samoans are Immigrants from Guyana (2.2%, a difference of 0.030%), Pennsylvania German (2.2%, a difference of 0.14%), Dutch (2.2%, a difference of 0.16%), Immigrants from Zaire (2.2%, a difference of 0.25%), and Immigrants from Nigeria (2.2%, a difference of 0.27%).
| Demographics | Rating | Rank | Vision Disability |
| Czechoslovakians | 21.6 /100 | #198 | Fair 2.2% |
| Immigrants | El Salvador | 21.0 /100 | #199 | Fair 2.2% |
| Immigrants | Thailand | 20.1 /100 | #200 | Fair 2.2% |
| Slovaks | 18.8 /100 | #201 | Poor 2.2% |
| Immigrants | Zaire | 18.0 /100 | #202 | Poor 2.2% |
| Dutch | 17.1 /100 | #203 | Poor 2.2% |
| Immigrants | Guyana | 15.9 /100 | #204 | Poor 2.2% |
| Samoans | 15.7 /100 | #205 | Poor 2.2% |
| Pennsylvania Germans | 14.5 /100 | #206 | Poor 2.2% |
| Immigrants | Nigeria | 13.5 /100 | #207 | Poor 2.2% |
| Germans | 13.4 /100 | #208 | Poor 2.2% |
| Immigrants | Brazil | 13.1 /100 | #209 | Poor 2.2% |
| Immigrants | Uruguay | 11.5 /100 | #210 | Poor 2.2% |
| Indonesians | 9.5 /100 | #211 | Tragic 2.2% |
| Bermudans | 9.0 /100 | #212 | Tragic 2.2% |
Demographics Similar to Immigrants from Russia by Vision Disability
In terms of vision disability, the demographic groups most similar to Immigrants from Russia are Immigrants from Belgium (2.0%, a difference of 0.020%), Immigrants from Romania (2.0%, a difference of 0.030%), Argentinean (2.0%, a difference of 0.060%), Armenian (2.0%, a difference of 0.11%), and Immigrants from Saudi Arabia (2.0%, a difference of 0.21%).
| Demographics | Rating | Rank | Vision Disability |
| Laotians | 99.3 /100 | #55 | Exceptional 2.0% |
| Jordanians | 99.2 /100 | #56 | Exceptional 2.0% |
| Somalis | 99.2 /100 | #57 | Exceptional 2.0% |
| Immigrants | Saudi Arabia | 99.2 /100 | #58 | Exceptional 2.0% |
| Argentineans | 99.1 /100 | #59 | Exceptional 2.0% |
| Immigrants | Romania | 99.1 /100 | #60 | Exceptional 2.0% |
| Immigrants | Belgium | 99.1 /100 | #61 | Exceptional 2.0% |
| Immigrants | Russia | 99.1 /100 | #62 | Exceptional 2.0% |
| Armenians | 99.0 /100 | #63 | Exceptional 2.0% |
| Immigrants | Greece | 99.0 /100 | #64 | Exceptional 2.0% |
| Maltese | 98.9 /100 | #65 | Exceptional 2.0% |
| Immigrants | Argentina | 98.9 /100 | #66 | Exceptional 2.0% |
| Immigrants | Northern Africa | 98.8 /100 | #67 | Exceptional 2.0% |
| Immigrants | Czechoslovakia | 98.7 /100 | #68 | Exceptional 2.0% |
| Russians | 98.6 /100 | #69 | Exceptional 2.0% |