Samoan vs Navajo 1st Grade
COMPARE
Samoan
Navajo
1st Grade
1st Grade Comparison
Samoans
Navajo
97.7%
1ST GRADE
6.8/ 100
METRIC RATING
217th/ 347
METRIC RANK
97.9%
1ST GRADE
56.6/ 100
METRIC RATING
166th/ 347
METRIC RANK
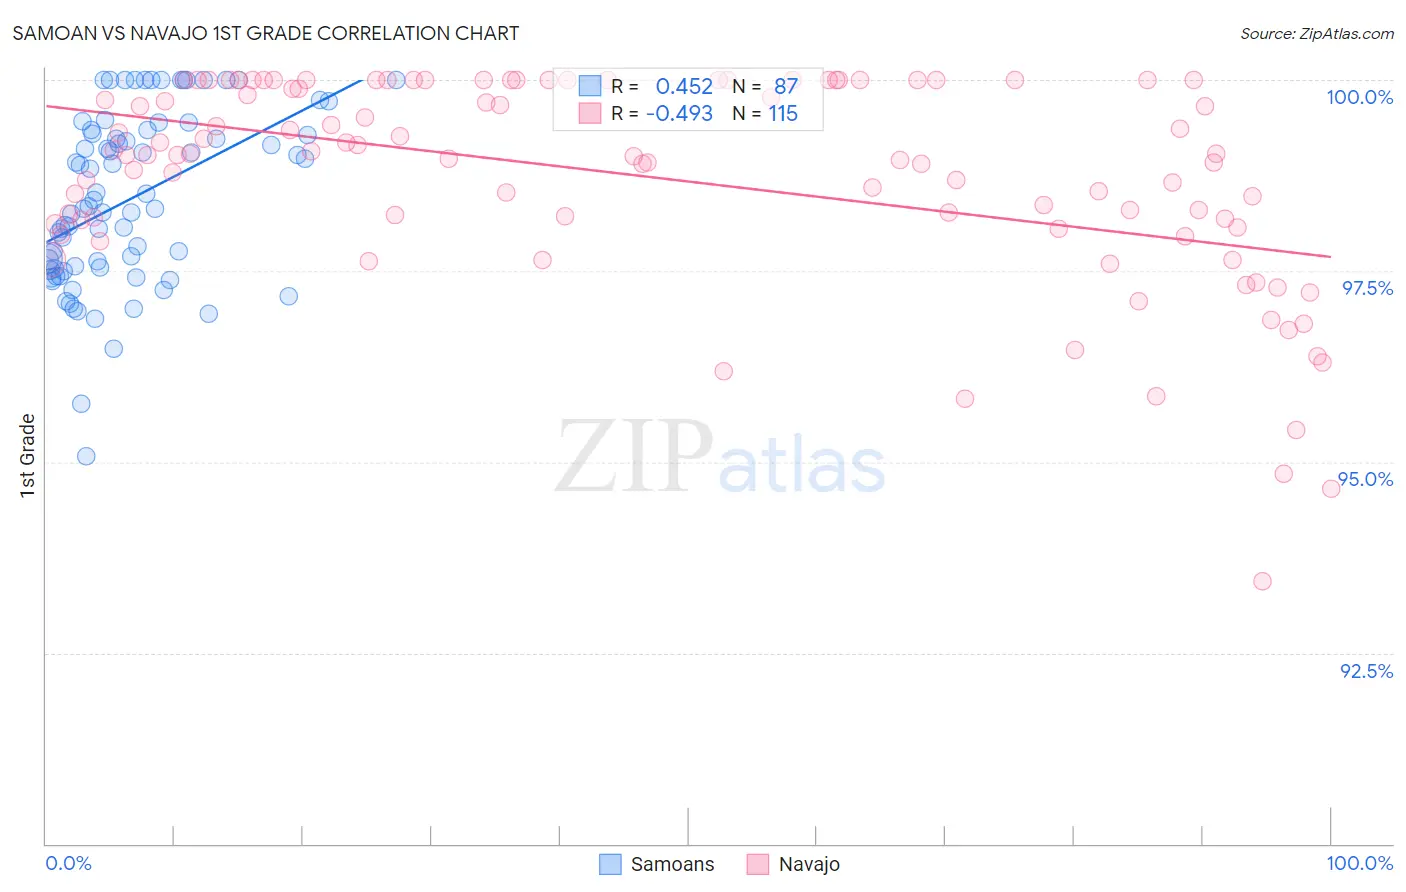
Samoan vs Navajo 1st Grade Correlation Chart
The statistical analysis conducted on geographies consisting of 225,201,431 people shows a moderate positive correlation between the proportion of Samoans and percentage of population with at least 1st grade education in the United States with a correlation coefficient (R) of 0.452 and weighted average of 97.7%. Similarly, the statistical analysis conducted on geographies consisting of 224,872,493 people shows a moderate negative correlation between the proportion of Navajo and percentage of population with at least 1st grade education in the United States with a correlation coefficient (R) of -0.493 and weighted average of 97.9%, a difference of 0.22%.
1st Grade Correlation Summary
| Measurement | Samoan | Navajo |
| Minimum | 95.1% | 93.4% |
| Maximum | 100.0% | 100.0% |
| Range | 4.9% | 6.6% |
| Mean | 98.4% | 98.7% |
| Median | 98.3% | 99.0% |
| Interquartile 25% (IQ1) | 97.5% | 98.1% |
| Interquartile 75% (IQ3) | 99.3% | 100.0% |
| Interquartile Range (IQR) | 1.8% | 1.9% |
| Standard Deviation (Sample) | 1.1% | 1.4% |
| Standard Deviation (Population) | 1.1% | 1.3% |
Similar Demographics by 1st Grade
Demographics Similar to Samoans by 1st Grade
In terms of 1st grade, the demographic groups most similar to Samoans are Immigrants from Bahamas (97.7%, a difference of 0.010%), South American Indian (97.7%, a difference of 0.010%), Bahamian (97.7%, a difference of 0.010%), Uruguayan (97.7%, a difference of 0.010%), and Moroccan (97.7%, a difference of 0.020%).
| Demographics | Rating | Rank | 1st Grade |
| Immigrants | Oceania | 11.0 /100 | #210 | Poor 97.8% |
| Laotians | 10.3 /100 | #211 | Poor 97.8% |
| Moroccans | 8.7 /100 | #212 | Tragic 97.7% |
| Immigrants | Bahamas | 8.1 /100 | #213 | Tragic 97.7% |
| South American Indians | 7.6 /100 | #214 | Tragic 97.7% |
| Bahamians | 7.5 /100 | #215 | Tragic 97.7% |
| Uruguayans | 7.4 /100 | #216 | Tragic 97.7% |
| Samoans | 6.8 /100 | #217 | Tragic 97.7% |
| Immigrants | Morocco | 5.3 /100 | #218 | Tragic 97.7% |
| Immigrants | Panama | 5.2 /100 | #219 | Tragic 97.7% |
| Tongans | 4.6 /100 | #220 | Tragic 97.7% |
| Immigrants | Sudan | 4.3 /100 | #221 | Tragic 97.7% |
| Immigrants | Syria | 4.2 /100 | #222 | Tragic 97.7% |
| Immigrants | Zaire | 4.1 /100 | #223 | Tragic 97.7% |
| Iraqis | 4.0 /100 | #224 | Tragic 97.7% |
Demographics Similar to Navajo by 1st Grade
In terms of 1st grade, the demographic groups most similar to Navajo are Spanish American (97.9%, a difference of 0.0%), Brazilian (97.9%, a difference of 0.0%), Ugandan (97.9%, a difference of 0.0%), Bermudan (97.9%, a difference of 0.0%), and Chilean (97.9%, a difference of 0.0%).
| Demographics | Rating | Rank | 1st Grade |
| French American Indians | 63.7 /100 | #159 | Good 98.0% |
| Immigrants | Russia | 59.2 /100 | #160 | Average 97.9% |
| Immigrants | Italy | 59.1 /100 | #161 | Average 97.9% |
| Immigrants | Eastern Europe | 58.9 /100 | #162 | Average 97.9% |
| Spanish Americans | 57.7 /100 | #163 | Average 97.9% |
| Brazilians | 57.6 /100 | #164 | Average 97.9% |
| Ugandans | 56.9 /100 | #165 | Average 97.9% |
| Navajo | 56.6 /100 | #166 | Average 97.9% |
| Bermudans | 56.3 /100 | #167 | Average 97.9% |
| Chileans | 55.6 /100 | #168 | Average 97.9% |
| Immigrants | Micronesia | 55.3 /100 | #169 | Average 97.9% |
| Immigrants | Spain | 54.9 /100 | #170 | Average 97.9% |
| Immigrants | Jordan | 53.9 /100 | #171 | Average 97.9% |
| Immigrants | Korea | 53.0 /100 | #172 | Average 97.9% |
| Kenyans | 51.2 /100 | #173 | Average 97.9% |