Samoan vs Immigrants from St. Vincent and the Grenadines Disability Age 18 to 34
COMPARE
Samoan
Immigrants from St. Vincent and the Grenadines
Disability Age 18 to 34
Disability Age 18 to 34 Comparison
Samoans
Immigrants from St. Vincent and the Grenadines
7.0%
DISABILITY AGE 18 TO 34
3.2/ 100
METRIC RATING
232nd/ 347
METRIC RANK
5.5%
DISABILITY AGE 18 TO 34
100.0/ 100
METRIC RATING
12th/ 347
METRIC RANK
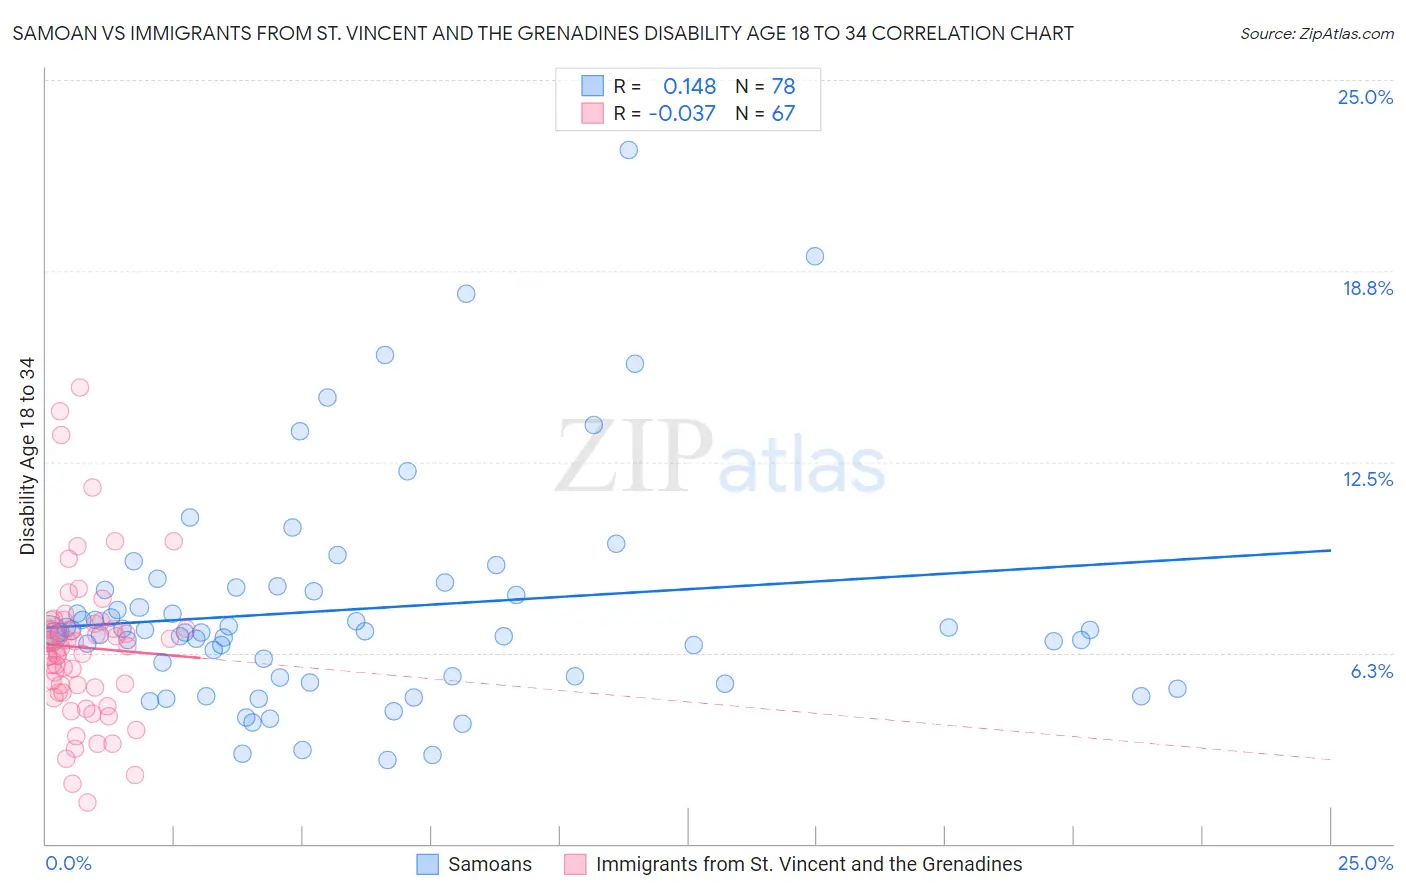
Samoan vs Immigrants from St. Vincent and the Grenadines Disability Age 18 to 34 Correlation Chart
The statistical analysis conducted on geographies consisting of 224,878,190 people shows a poor positive correlation between the proportion of Samoans and percentage of population with a disability between the ages 18 and 35 in the United States with a correlation coefficient (R) of 0.148 and weighted average of 7.0%. Similarly, the statistical analysis conducted on geographies consisting of 56,176,213 people shows no correlation between the proportion of Immigrants from St. Vincent and the Grenadines and percentage of population with a disability between the ages 18 and 35 in the United States with a correlation coefficient (R) of -0.037 and weighted average of 5.5%, a difference of 26.5%.
Disability Age 18 to 34 Correlation Summary
| Measurement | Samoan | Immigrants from St. Vincent and the Grenadines |
| Minimum | 2.7% | 1.4% |
| Maximum | 22.7% | 14.9% |
| Range | 20.0% | 13.6% |
| Mean | 7.7% | 6.4% |
| Median | 6.9% | 6.4% |
| Interquartile 25% (IQ1) | 5.5% | 5.0% |
| Interquartile 75% (IQ3) | 8.3% | 7.2% |
| Interquartile Range (IQR) | 2.8% | 2.2% |
| Standard Deviation (Sample) | 3.7% | 2.6% |
| Standard Deviation (Population) | 3.6% | 2.5% |
Similar Demographics by Disability Age 18 to 34
Demographics Similar to Samoans by Disability Age 18 to 34
In terms of disability age 18 to 34, the demographic groups most similar to Samoans are New Zealander (7.0%, a difference of 0.26%), Ute (7.0%, a difference of 0.30%), Immigrants from North America (7.0%, a difference of 0.32%), Lithuanian (7.0%, a difference of 0.41%), and Immigrants from Yemen (7.0%, a difference of 0.44%).
| Demographics | Rating | Rank | Disability Age 18 to 34 |
| Central American Indians | 4.7 /100 | #225 | Tragic 6.9% |
| Ugandans | 4.4 /100 | #226 | Tragic 6.9% |
| Immigrants | Canada | 4.3 /100 | #227 | Tragic 7.0% |
| Immigrants | Yemen | 4.2 /100 | #228 | Tragic 7.0% |
| Lithuanians | 4.1 /100 | #229 | Tragic 7.0% |
| Immigrants | North America | 3.9 /100 | #230 | Tragic 7.0% |
| Ute | 3.8 /100 | #231 | Tragic 7.0% |
| Samoans | 3.2 /100 | #232 | Tragic 7.0% |
| New Zealanders | 2.7 /100 | #233 | Tragic 7.0% |
| Alsatians | 2.1 /100 | #234 | Tragic 7.0% |
| Sub-Saharan Africans | 1.7 /100 | #235 | Tragic 7.1% |
| Liberians | 1.5 /100 | #236 | Tragic 7.1% |
| Austrians | 1.3 /100 | #237 | Tragic 7.1% |
| Marshallese | 1.3 /100 | #238 | Tragic 7.1% |
| Italians | 1.2 /100 | #239 | Tragic 7.1% |
Demographics Similar to Immigrants from St. Vincent and the Grenadines by Disability Age 18 to 34
In terms of disability age 18 to 34, the demographic groups most similar to Immigrants from St. Vincent and the Grenadines are Vietnamese (5.5%, a difference of 0.060%), Immigrants from Uzbekistan (5.5%, a difference of 0.13%), Guyanese (5.5%, a difference of 0.28%), Immigrants from Iran (5.5%, a difference of 0.32%), and Indian (Asian) (5.5%, a difference of 0.47%).
| Demographics | Rating | Rank | Disability Age 18 to 34 |
| Immigrants | Taiwan | 100.0 /100 | #5 | Exceptional 5.4% |
| Filipinos | 100.0 /100 | #6 | Exceptional 5.4% |
| Immigrants | China | 100.0 /100 | #7 | Exceptional 5.4% |
| Immigrants | Guyana | 100.0 /100 | #8 | Exceptional 5.5% |
| Guyanese | 100.0 /100 | #9 | Exceptional 5.5% |
| Immigrants | Uzbekistan | 100.0 /100 | #10 | Exceptional 5.5% |
| Vietnamese | 100.0 /100 | #11 | Exceptional 5.5% |
| Immigrants | St. Vincent and the Grenadines | 100.0 /100 | #12 | Exceptional 5.5% |
| Immigrants | Iran | 100.0 /100 | #13 | Exceptional 5.5% |
| Indians (Asian) | 100.0 /100 | #14 | Exceptional 5.5% |
| Immigrants | India | 100.0 /100 | #15 | Exceptional 5.6% |
| Immigrants | Israel | 100.0 /100 | #16 | Exceptional 5.6% |
| Immigrants | Eastern Asia | 100.0 /100 | #17 | Exceptional 5.6% |
| Immigrants | Bolivia | 100.0 /100 | #18 | Exceptional 5.6% |
| Thais | 100.0 /100 | #19 | Exceptional 5.6% |