Salvadoran vs Immigrants from Portugal Disability Age 18 to 34
COMPARE
Salvadoran
Immigrants from Portugal
Disability Age 18 to 34
Disability Age 18 to 34 Comparison
Salvadorans
Immigrants from Portugal
6.0%
DISABILITY AGE 18 TO 34
99.6/ 100
METRIC RATING
63rd/ 347
METRIC RANK
7.4%
DISABILITY AGE 18 TO 34
0.1/ 100
METRIC RATING
277th/ 347
METRIC RANK
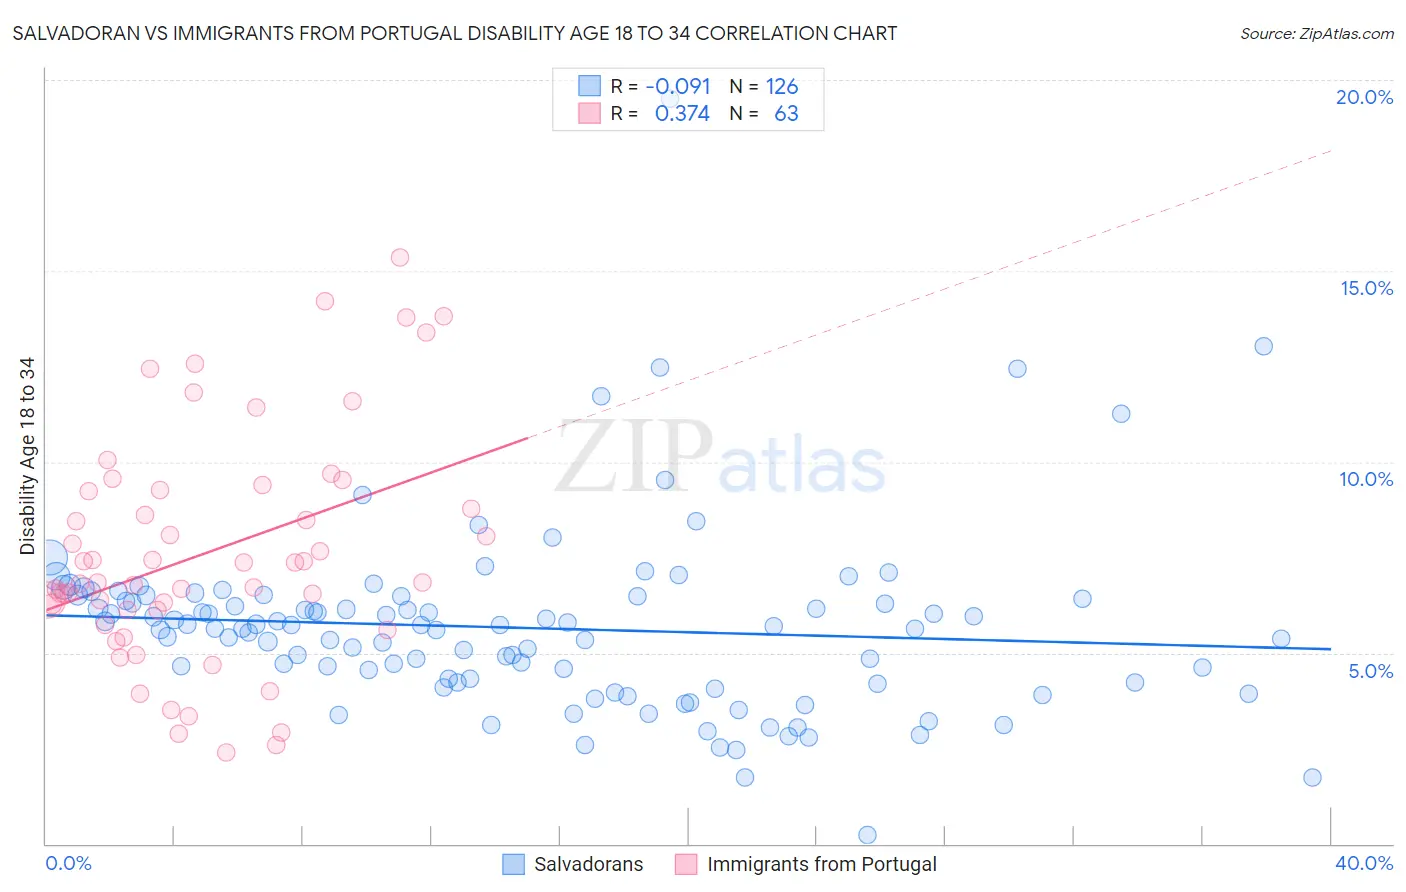
Salvadoran vs Immigrants from Portugal Disability Age 18 to 34 Correlation Chart
The statistical analysis conducted on geographies consisting of 398,205,845 people shows a slight negative correlation between the proportion of Salvadorans and percentage of population with a disability between the ages 18 and 35 in the United States with a correlation coefficient (R) of -0.091 and weighted average of 6.0%. Similarly, the statistical analysis conducted on geographies consisting of 174,521,436 people shows a mild positive correlation between the proportion of Immigrants from Portugal and percentage of population with a disability between the ages 18 and 35 in the United States with a correlation coefficient (R) of 0.374 and weighted average of 7.4%, a difference of 24.4%.
Disability Age 18 to 34 Correlation Summary
| Measurement | Salvadoran | Immigrants from Portugal |
| Minimum | 0.22% | 2.4% |
| Maximum | 19.5% | 15.4% |
| Range | 19.3% | 13.0% |
| Mean | 5.7% | 7.6% |
| Median | 5.7% | 6.8% |
| Interquartile 25% (IQ1) | 4.2% | 6.1% |
| Interquartile 75% (IQ3) | 6.5% | 9.3% |
| Interquartile Range (IQR) | 2.2% | 3.2% |
| Standard Deviation (Sample) | 2.4% | 3.0% |
| Standard Deviation (Population) | 2.4% | 3.0% |
Similar Demographics by Disability Age 18 to 34
Demographics Similar to Salvadorans by Disability Age 18 to 34
In terms of disability age 18 to 34, the demographic groups most similar to Salvadorans are Taiwanese (6.0%, a difference of 0.010%), Peruvian (6.0%, a difference of 0.050%), British West Indian (6.0%, a difference of 0.080%), Trinidadian and Tobagonian (6.0%, a difference of 0.15%), and Burmese (6.0%, a difference of 0.29%).
| Demographics | Rating | Rank | Disability Age 18 to 34 |
| Paraguayans | 99.7 /100 | #56 | Exceptional 5.9% |
| Immigrants | Haiti | 99.7 /100 | #57 | Exceptional 5.9% |
| Immigrants | Serbia | 99.7 /100 | #58 | Exceptional 5.9% |
| Immigrants | Caribbean | 99.6 /100 | #59 | Exceptional 6.0% |
| Immigrants | Sri Lanka | 99.6 /100 | #60 | Exceptional 6.0% |
| British West Indians | 99.6 /100 | #61 | Exceptional 6.0% |
| Peruvians | 99.6 /100 | #62 | Exceptional 6.0% |
| Salvadorans | 99.6 /100 | #63 | Exceptional 6.0% |
| Taiwanese | 99.6 /100 | #64 | Exceptional 6.0% |
| Trinidadians and Tobagonians | 99.5 /100 | #65 | Exceptional 6.0% |
| Burmese | 99.5 /100 | #66 | Exceptional 6.0% |
| Immigrants | North Macedonia | 99.5 /100 | #67 | Exceptional 6.0% |
| Immigrants | Poland | 99.5 /100 | #68 | Exceptional 6.0% |
| Immigrants | West Indies | 99.4 /100 | #69 | Exceptional 6.0% |
| Immigrants | Greece | 99.4 /100 | #70 | Exceptional 6.0% |
Demographics Similar to Immigrants from Portugal by Disability Age 18 to 34
In terms of disability age 18 to 34, the demographic groups most similar to Immigrants from Portugal are Lumbee (7.4%, a difference of 0.030%), Czechoslovakian (7.4%, a difference of 0.070%), Yaqui (7.4%, a difference of 0.070%), European (7.4%, a difference of 0.44%), and Immigrants from Somalia (7.4%, a difference of 0.48%).
| Demographics | Rating | Rank | Disability Age 18 to 34 |
| Belgians | 0.1 /100 | #270 | Tragic 7.4% |
| Swiss | 0.1 /100 | #271 | Tragic 7.4% |
| Tsimshian | 0.1 /100 | #272 | Tragic 7.4% |
| Slavs | 0.1 /100 | #273 | Tragic 7.4% |
| Africans | 0.1 /100 | #274 | Tragic 7.4% |
| Immigrants | Somalia | 0.1 /100 | #275 | Tragic 7.4% |
| Europeans | 0.1 /100 | #276 | Tragic 7.4% |
| Immigrants | Portugal | 0.1 /100 | #277 | Tragic 7.4% |
| Lumbee | 0.1 /100 | #278 | Tragic 7.4% |
| Czechoslovakians | 0.1 /100 | #279 | Tragic 7.4% |
| Yaqui | 0.1 /100 | #280 | Tragic 7.4% |
| Paiute | 0.0 /100 | #281 | Tragic 7.5% |
| Spanish | 0.0 /100 | #282 | Tragic 7.5% |
| Danes | 0.0 /100 | #283 | Tragic 7.5% |
| Hopi | 0.0 /100 | #284 | Tragic 7.5% |