Salvadoran vs Immigrants from Portugal 4th Grade
COMPARE
Salvadoran
Immigrants from Portugal
4th Grade
4th Grade Comparison
Salvadorans
Immigrants from Portugal
95.0%
4TH GRADE
0.0/ 100
METRIC RATING
345th/ 347
METRIC RANK
96.6%
4TH GRADE
0.0/ 100
METRIC RATING
295th/ 347
METRIC RANK
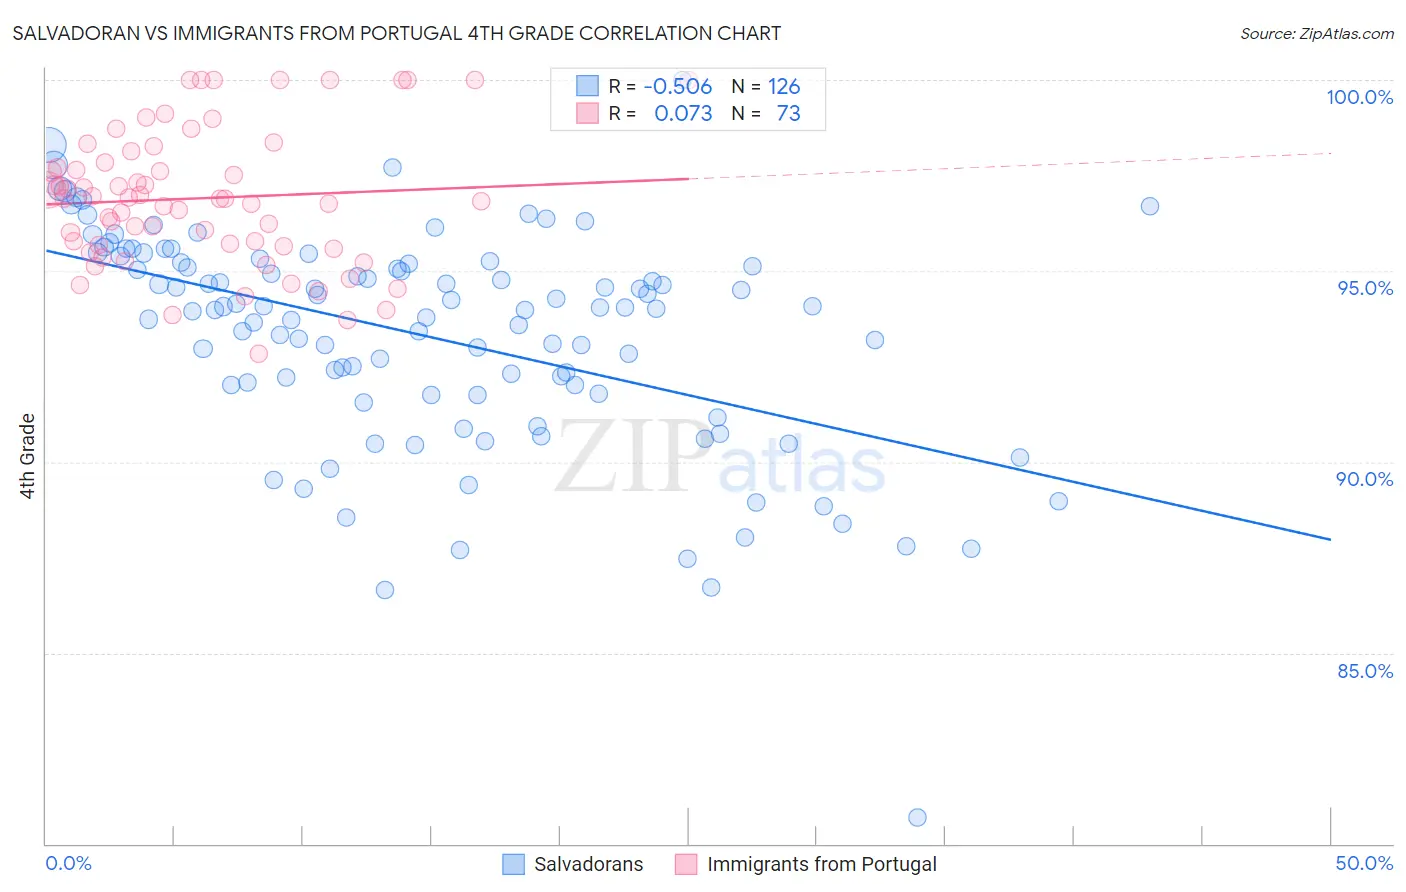
Salvadoran vs Immigrants from Portugal 4th Grade Correlation Chart
The statistical analysis conducted on geographies consisting of 399,033,726 people shows a substantial negative correlation between the proportion of Salvadorans and percentage of population with at least 4th grade education in the United States with a correlation coefficient (R) of -0.506 and weighted average of 95.0%. Similarly, the statistical analysis conducted on geographies consisting of 174,792,107 people shows a slight positive correlation between the proportion of Immigrants from Portugal and percentage of population with at least 4th grade education in the United States with a correlation coefficient (R) of 0.073 and weighted average of 96.6%, a difference of 1.7%.
4th Grade Correlation Summary
| Measurement | Salvadoran | Immigrants from Portugal |
| Minimum | 80.7% | 92.8% |
| Maximum | 100.0% | 100.0% |
| Range | 19.3% | 7.2% |
| Mean | 93.3% | 96.9% |
| Median | 94.0% | 96.9% |
| Interquartile 25% (IQ1) | 91.8% | 95.7% |
| Interquartile 75% (IQ3) | 95.2% | 98.0% |
| Interquartile Range (IQR) | 3.4% | 2.3% |
| Standard Deviation (Sample) | 2.9% | 1.8% |
| Standard Deviation (Population) | 2.9% | 1.8% |
Similar Demographics by 4th Grade
Demographics Similar to Salvadorans by 4th Grade
In terms of 4th grade, the demographic groups most similar to Salvadorans are Immigrants from Mexico (95.1%, a difference of 0.010%), Immigrants from Guatemala (95.1%, a difference of 0.040%), Immigrants from Central America (95.1%, a difference of 0.070%), Immigrants from Yemen (95.2%, a difference of 0.15%), and Yakama (95.2%, a difference of 0.16%).
| Demographics | Rating | Rank | 4th Grade |
| Immigrants | Dominican Republic | 0.0 /100 | #333 | Tragic 95.7% |
| Immigrants | Cabo Verde | 0.0 /100 | #334 | Tragic 95.7% |
| Immigrants | Latin America | 0.0 /100 | #335 | Tragic 95.7% |
| Mexicans | 0.0 /100 | #336 | Tragic 95.6% |
| Central Americans | 0.0 /100 | #337 | Tragic 95.5% |
| Nepalese | 0.0 /100 | #338 | Tragic 95.5% |
| Guatemalans | 0.0 /100 | #339 | Tragic 95.3% |
| Yakama | 0.0 /100 | #340 | Tragic 95.2% |
| Immigrants | Yemen | 0.0 /100 | #341 | Tragic 95.2% |
| Immigrants | Central America | 0.0 /100 | #342 | Tragic 95.1% |
| Immigrants | Guatemala | 0.0 /100 | #343 | Tragic 95.1% |
| Immigrants | Mexico | 0.0 /100 | #344 | Tragic 95.1% |
| Salvadorans | 0.0 /100 | #345 | Tragic 95.0% |
| Immigrants | El Salvador | 0.0 /100 | #346 | Tragic 94.8% |
| Spanish American Indians | 0.0 /100 | #347 | Tragic 94.6% |
Demographics Similar to Immigrants from Portugal by 4th Grade
In terms of 4th grade, the demographic groups most similar to Immigrants from Portugal are Somali (96.6%, a difference of 0.010%), Immigrants from Eritrea (96.7%, a difference of 0.020%), Puerto Rican (96.7%, a difference of 0.040%), Malaysian (96.7%, a difference of 0.060%), and Immigrants from Grenada (96.7%, a difference of 0.070%).
| Demographics | Rating | Rank | 4th Grade |
| Immigrants | Afghanistan | 0.0 /100 | #288 | Tragic 96.8% |
| Immigrants | West Indies | 0.0 /100 | #289 | Tragic 96.7% |
| British West Indians | 0.0 /100 | #290 | Tragic 96.7% |
| Immigrants | Grenada | 0.0 /100 | #291 | Tragic 96.7% |
| Malaysians | 0.0 /100 | #292 | Tragic 96.7% |
| Puerto Ricans | 0.0 /100 | #293 | Tragic 96.7% |
| Immigrants | Eritrea | 0.0 /100 | #294 | Tragic 96.7% |
| Immigrants | Portugal | 0.0 /100 | #295 | Tragic 96.6% |
| Somalis | 0.0 /100 | #296 | Tragic 96.6% |
| Immigrants | Somalia | 0.0 /100 | #297 | Tragic 96.5% |
| Haitians | 0.0 /100 | #298 | Tragic 96.5% |
| Immigrants | Dominica | 0.0 /100 | #299 | Tragic 96.5% |
| Immigrants | South Eastern Asia | 0.0 /100 | #300 | Tragic 96.5% |
| Immigrants | Immigrants | 0.0 /100 | #301 | Tragic 96.5% |
| Immigrants | Cuba | 0.0 /100 | #302 | Tragic 96.4% |