Salvadoran vs Egyptian Disability Age 18 to 34
COMPARE
Salvadoran
Egyptian
Disability Age 18 to 34
Disability Age 18 to 34 Comparison
Salvadorans
Egyptians
6.0%
DISABILITY AGE 18 TO 34
99.6/ 100
METRIC RATING
63rd/ 347
METRIC RANK
5.9%
DISABILITY AGE 18 TO 34
99.8/ 100
METRIC RATING
51st/ 347
METRIC RANK
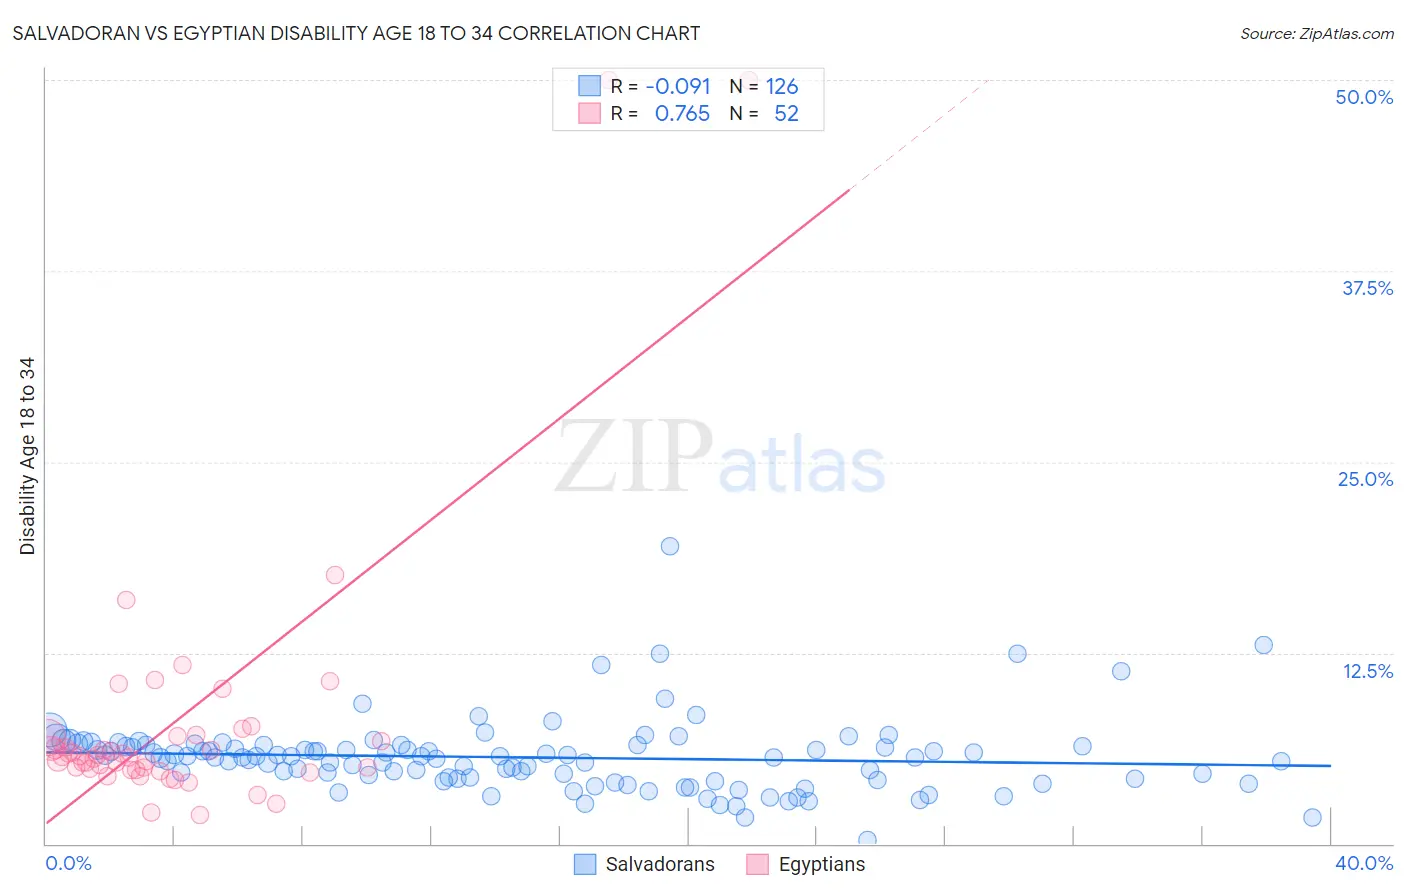
Salvadoran vs Egyptian Disability Age 18 to 34 Correlation Chart
The statistical analysis conducted on geographies consisting of 398,205,845 people shows a slight negative correlation between the proportion of Salvadorans and percentage of population with a disability between the ages 18 and 35 in the United States with a correlation coefficient (R) of -0.091 and weighted average of 6.0%. Similarly, the statistical analysis conducted on geographies consisting of 276,674,150 people shows a strong positive correlation between the proportion of Egyptians and percentage of population with a disability between the ages 18 and 35 in the United States with a correlation coefficient (R) of 0.765 and weighted average of 5.9%, a difference of 1.1%.
Disability Age 18 to 34 Correlation Summary
| Measurement | Salvadoran | Egyptian |
| Minimum | 0.22% | 1.9% |
| Maximum | 19.5% | 50.0% |
| Range | 19.3% | 48.1% |
| Mean | 5.7% | 8.0% |
| Median | 5.7% | 5.7% |
| Interquartile 25% (IQ1) | 4.2% | 4.9% |
| Interquartile 75% (IQ3) | 6.5% | 7.0% |
| Interquartile Range (IQR) | 2.2% | 2.2% |
| Standard Deviation (Sample) | 2.4% | 9.0% |
| Standard Deviation (Population) | 2.4% | 8.9% |
Demographics Similar to Salvadorans and Egyptians by Disability Age 18 to 34
In terms of disability age 18 to 34, the demographic groups most similar to Salvadorans are Taiwanese (6.0%, a difference of 0.010%), Peruvian (6.0%, a difference of 0.050%), British West Indian (6.0%, a difference of 0.080%), Trinidadian and Tobagonian (6.0%, a difference of 0.15%), and Burmese (6.0%, a difference of 0.29%). Similarly, the demographic groups most similar to Egyptians are Immigrants from El Salvador (5.9%, a difference of 0.0%), Immigrants from Belarus (5.9%, a difference of 0.040%), Okinawan (5.9%, a difference of 0.13%), Immigrants from Trinidad and Tobago (5.9%, a difference of 0.14%), and Immigrants from Indonesia (5.9%, a difference of 0.28%).
| Demographics | Rating | Rank | Disability Age 18 to 34 |
| Immigrants | Egypt | 99.8 /100 | #47 | Exceptional 5.9% |
| Immigrants | Trinidad and Tobago | 99.8 /100 | #48 | Exceptional 5.9% |
| Immigrants | Belarus | 99.8 /100 | #49 | Exceptional 5.9% |
| Immigrants | El Salvador | 99.8 /100 | #50 | Exceptional 5.9% |
| Egyptians | 99.8 /100 | #51 | Exceptional 5.9% |
| Okinawans | 99.7 /100 | #52 | Exceptional 5.9% |
| Immigrants | Indonesia | 99.7 /100 | #53 | Exceptional 5.9% |
| Immigrants | Malaysia | 99.7 /100 | #54 | Exceptional 5.9% |
| Immigrants | Spain | 99.7 /100 | #55 | Exceptional 5.9% |
| Paraguayans | 99.7 /100 | #56 | Exceptional 5.9% |
| Immigrants | Haiti | 99.7 /100 | #57 | Exceptional 5.9% |
| Immigrants | Serbia | 99.7 /100 | #58 | Exceptional 5.9% |
| Immigrants | Caribbean | 99.6 /100 | #59 | Exceptional 6.0% |
| Immigrants | Sri Lanka | 99.6 /100 | #60 | Exceptional 6.0% |
| British West Indians | 99.6 /100 | #61 | Exceptional 6.0% |
| Peruvians | 99.6 /100 | #62 | Exceptional 6.0% |
| Salvadorans | 99.6 /100 | #63 | Exceptional 6.0% |
| Taiwanese | 99.6 /100 | #64 | Exceptional 6.0% |
| Trinidadians and Tobagonians | 99.5 /100 | #65 | Exceptional 6.0% |
| Burmese | 99.5 /100 | #66 | Exceptional 6.0% |
| Immigrants | North Macedonia | 99.5 /100 | #67 | Exceptional 6.0% |