Paiute vs Hispanic or Latino Vision Disability
COMPARE
Paiute
Hispanic or Latino
Vision Disability
Vision Disability Comparison
Paiute
Hispanics or Latinos
2.9%
VISION DISABILITY
0.0/ 100
METRIC RATING
322nd/ 347
METRIC RANK
2.6%
VISION DISABILITY
0.0/ 100
METRIC RATING
305th/ 347
METRIC RANK
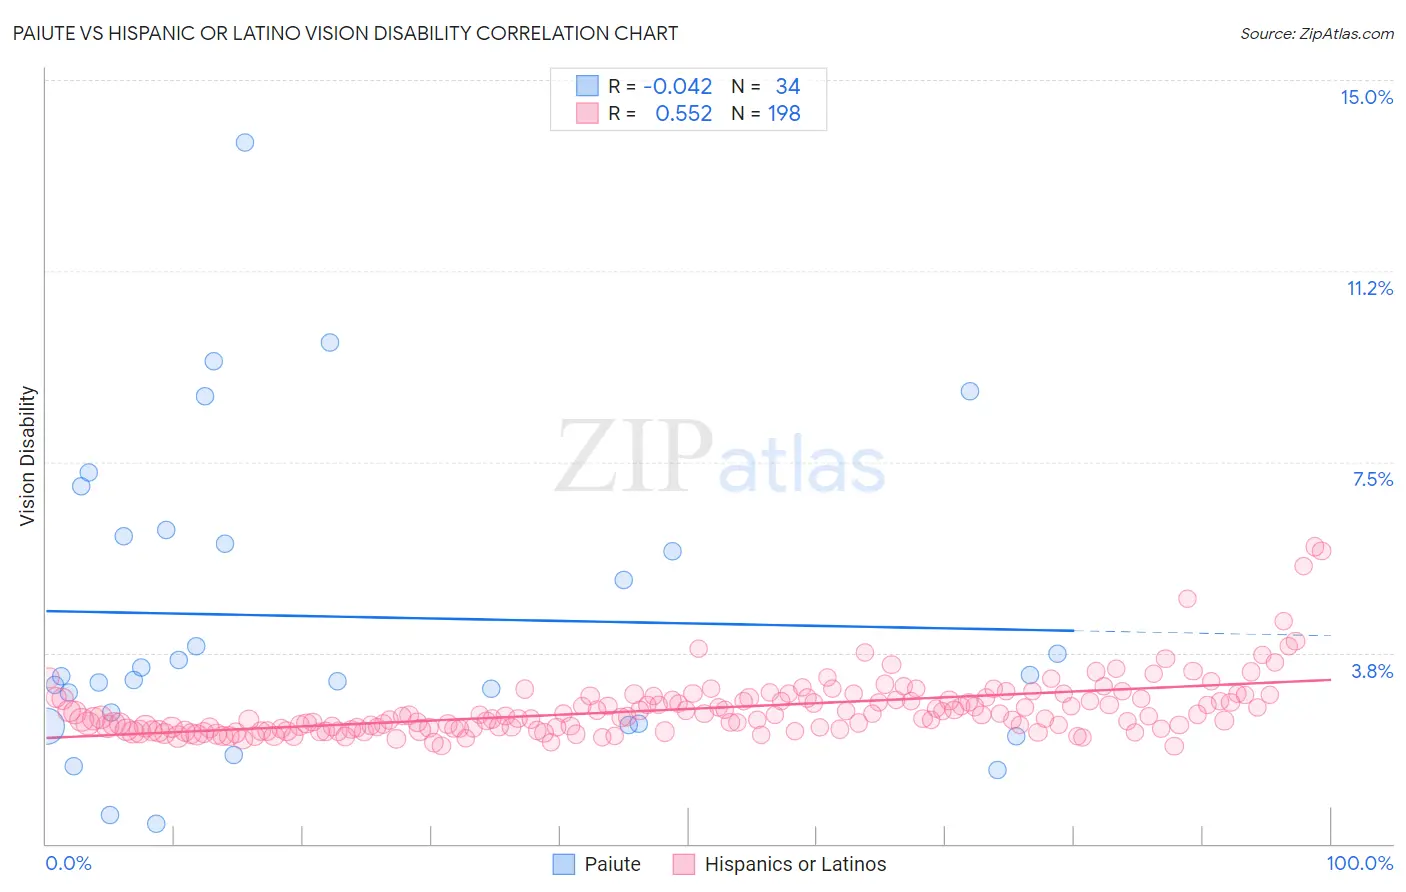
Paiute vs Hispanic or Latino Vision Disability Correlation Chart
The statistical analysis conducted on geographies consisting of 58,384,009 people shows no correlation between the proportion of Paiute and percentage of population with vision disability in the United States with a correlation coefficient (R) of -0.042 and weighted average of 2.9%. Similarly, the statistical analysis conducted on geographies consisting of 574,500,029 people shows a substantial positive correlation between the proportion of Hispanics or Latinos and percentage of population with vision disability in the United States with a correlation coefficient (R) of 0.552 and weighted average of 2.6%, a difference of 10.1%.
Vision Disability Correlation Summary
| Measurement | Paiute | Hispanic or Latino |
| Minimum | 0.39% | 1.9% |
| Maximum | 13.8% | 5.8% |
| Range | 13.4% | 3.9% |
| Mean | 4.5% | 2.6% |
| Median | 3.3% | 2.5% |
| Interquartile 25% (IQ1) | 2.4% | 2.3% |
| Interquartile 75% (IQ3) | 6.0% | 2.9% |
| Interquartile Range (IQR) | 3.7% | 0.59% |
| Standard Deviation (Sample) | 3.0% | 0.59% |
| Standard Deviation (Population) | 3.0% | 0.59% |
Demographics Similar to Paiute and Hispanics or Latinos by Vision Disability
In terms of vision disability, the demographic groups most similar to Paiute are Tlingit-Haida (2.9%, a difference of 0.0%), Comanche (2.8%, a difference of 0.42%), Black/African American (2.8%, a difference of 2.5%), Tohono O'odham (2.8%, a difference of 3.2%), and Alaska Native (2.7%, a difference of 4.6%). Similarly, the demographic groups most similar to Hispanics or Latinos are Aleut (2.6%, a difference of 0.30%), Immigrants from Cabo Verde (2.6%, a difference of 0.43%), Iroquois (2.6%, a difference of 0.61%), Immigrants from Dominican Republic (2.6%, a difference of 0.64%), and Arapaho (2.6%, a difference of 0.65%).
| Demographics | Rating | Rank | Vision Disability |
| Immigrants | Cabo Verde | 0.0 /100 | #303 | Tragic 2.6% |
| Aleuts | 0.0 /100 | #304 | Tragic 2.6% |
| Hispanics or Latinos | 0.0 /100 | #305 | Tragic 2.6% |
| Iroquois | 0.0 /100 | #306 | Tragic 2.6% |
| Immigrants | Dominican Republic | 0.0 /100 | #307 | Tragic 2.6% |
| Arapaho | 0.0 /100 | #308 | Tragic 2.6% |
| Immigrants | Yemen | 0.0 /100 | #309 | Tragic 2.6% |
| Blackfeet | 0.0 /100 | #310 | Tragic 2.6% |
| Dominicans | 0.0 /100 | #311 | Tragic 2.6% |
| Americans | 0.0 /100 | #312 | Tragic 2.6% |
| Potawatomi | 0.0 /100 | #313 | Tragic 2.6% |
| Inupiat | 0.0 /100 | #314 | Tragic 2.7% |
| Osage | 0.0 /100 | #315 | Tragic 2.7% |
| Shoshone | 0.0 /100 | #316 | Tragic 2.7% |
| Yup'ik | 0.0 /100 | #317 | Tragic 2.7% |
| Alaska Natives | 0.0 /100 | #318 | Tragic 2.7% |
| Tohono O'odham | 0.0 /100 | #319 | Tragic 2.8% |
| Blacks/African Americans | 0.0 /100 | #320 | Tragic 2.8% |
| Comanche | 0.0 /100 | #321 | Tragic 2.8% |
| Paiute | 0.0 /100 | #322 | Tragic 2.9% |
| Tlingit-Haida | 0.0 /100 | #323 | Tragic 2.9% |