Salvadoran vs Hispanic or Latino Single Father Poverty
COMPARE
Salvadoran
Hispanic or Latino
Single Father Poverty
Single Father Poverty Comparison
Salvadorans
Hispanics or Latinos
14.9%
SINGLE FATHER POVERTY
100.0/ 100
METRIC RATING
44th/ 347
METRIC RANK
16.8%
SINGLE FATHER POVERTY
6.1/ 100
METRIC RATING
226th/ 347
METRIC RANK
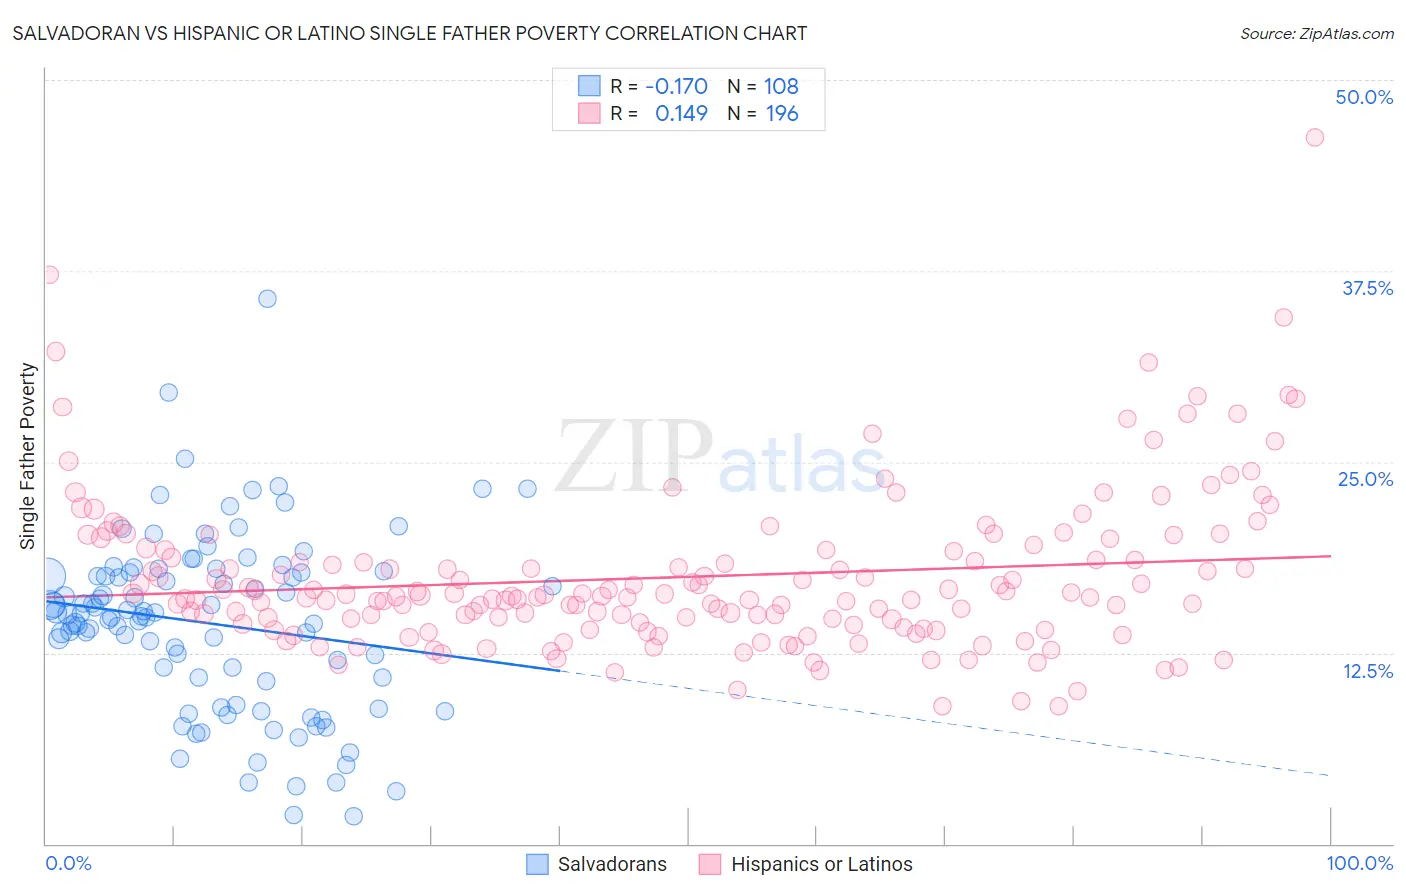
Salvadoran vs Hispanic or Latino Single Father Poverty Correlation Chart
The statistical analysis conducted on geographies consisting of 320,267,289 people shows a poor negative correlation between the proportion of Salvadorans and poverty level among single fathers in the United States with a correlation coefficient (R) of -0.170 and weighted average of 14.9%. Similarly, the statistical analysis conducted on geographies consisting of 409,583,815 people shows a poor positive correlation between the proportion of Hispanics or Latinos and poverty level among single fathers in the United States with a correlation coefficient (R) of 0.149 and weighted average of 16.8%, a difference of 12.7%.
Single Father Poverty Correlation Summary
| Measurement | Salvadoran | Hispanic or Latino |
| Minimum | 1.8% | 9.0% |
| Maximum | 35.7% | 46.2% |
| Range | 33.9% | 37.3% |
| Mean | 14.4% | 17.4% |
| Median | 15.0% | 16.2% |
| Interquartile 25% (IQ1) | 10.8% | 14.4% |
| Interquartile 75% (IQ3) | 17.7% | 19.2% |
| Interquartile Range (IQR) | 7.0% | 4.7% |
| Standard Deviation (Sample) | 5.8% | 5.1% |
| Standard Deviation (Population) | 5.8% | 5.1% |
Similar Demographics by Single Father Poverty
Demographics Similar to Salvadorans by Single Father Poverty
In terms of single father poverty, the demographic groups most similar to Salvadorans are Immigrants from Somalia (14.9%, a difference of 0.16%), Immigrants from Cambodia (14.9%, a difference of 0.28%), Immigrants from China (14.9%, a difference of 0.31%), Malaysian (14.9%, a difference of 0.32%), and Immigrants from Eastern Asia (15.0%, a difference of 0.47%).
| Demographics | Rating | Rank | Single Father Poverty |
| Immigrants | Eastern Africa | 100.0 /100 | #37 | Exceptional 14.7% |
| Bolivians | 100.0 /100 | #38 | Exceptional 14.7% |
| Immigrants | Asia | 100.0 /100 | #39 | Exceptional 14.7% |
| Pima | 100.0 /100 | #40 | Exceptional 14.8% |
| Indians (Asian) | 100.0 /100 | #41 | Exceptional 14.8% |
| Immigrants | Nepal | 100.0 /100 | #42 | Exceptional 14.8% |
| Immigrants | Eritrea | 100.0 /100 | #43 | Exceptional 14.8% |
| Salvadorans | 100.0 /100 | #44 | Exceptional 14.9% |
| Immigrants | Somalia | 100.0 /100 | #45 | Exceptional 14.9% |
| Immigrants | Cambodia | 99.9 /100 | #46 | Exceptional 14.9% |
| Immigrants | China | 99.9 /100 | #47 | Exceptional 14.9% |
| Malaysians | 99.9 /100 | #48 | Exceptional 14.9% |
| Immigrants | Eastern Asia | 99.9 /100 | #49 | Exceptional 15.0% |
| Bhutanese | 99.9 /100 | #50 | Exceptional 15.0% |
| Immigrants | Pakistan | 99.9 /100 | #51 | Exceptional 15.0% |
Demographics Similar to Hispanics or Latinos by Single Father Poverty
In terms of single father poverty, the demographic groups most similar to Hispanics or Latinos are Menominee (16.8%, a difference of 0.050%), Immigrants from Norway (16.8%, a difference of 0.070%), British (16.8%, a difference of 0.10%), Immigrants from Austria (16.8%, a difference of 0.15%), and Belgian (16.8%, a difference of 0.16%).
| Demographics | Rating | Rank | Single Father Poverty |
| Immigrants | Ghana | 8.1 /100 | #219 | Tragic 16.7% |
| Immigrants | Denmark | 8.1 /100 | #220 | Tragic 16.7% |
| Immigrants | Greece | 8.1 /100 | #221 | Tragic 16.7% |
| Immigrants | Spain | 8.0 /100 | #222 | Tragic 16.7% |
| Immigrants | Austria | 7.0 /100 | #223 | Tragic 16.8% |
| Immigrants | Norway | 6.5 /100 | #224 | Tragic 16.8% |
| Menominee | 6.4 /100 | #225 | Tragic 16.8% |
| Hispanics or Latinos | 6.1 /100 | #226 | Tragic 16.8% |
| British | 5.6 /100 | #227 | Tragic 16.8% |
| Belgians | 5.3 /100 | #228 | Tragic 16.8% |
| Israelis | 4.6 /100 | #229 | Tragic 16.8% |
| Immigrants | Trinidad and Tobago | 4.5 /100 | #230 | Tragic 16.8% |
| Spanish Americans | 3.7 /100 | #231 | Tragic 16.9% |
| Immigrants | Grenada | 3.7 /100 | #232 | Tragic 16.9% |
| Senegalese | 3.2 /100 | #233 | Tragic 16.9% |