Romanian vs Ukrainian Disability Age 65 to 74
COMPARE
Romanian
Ukrainian
Disability Age 65 to 74
Disability Age 65 to 74 Comparison
Romanians
Ukrainians
22.1%
DISABILITY AGE 65 TO 74
97.7/ 100
METRIC RATING
95th/ 347
METRIC RANK
22.3%
DISABILITY AGE 65 TO 74
95.1/ 100
METRIC RATING
114th/ 347
METRIC RANK
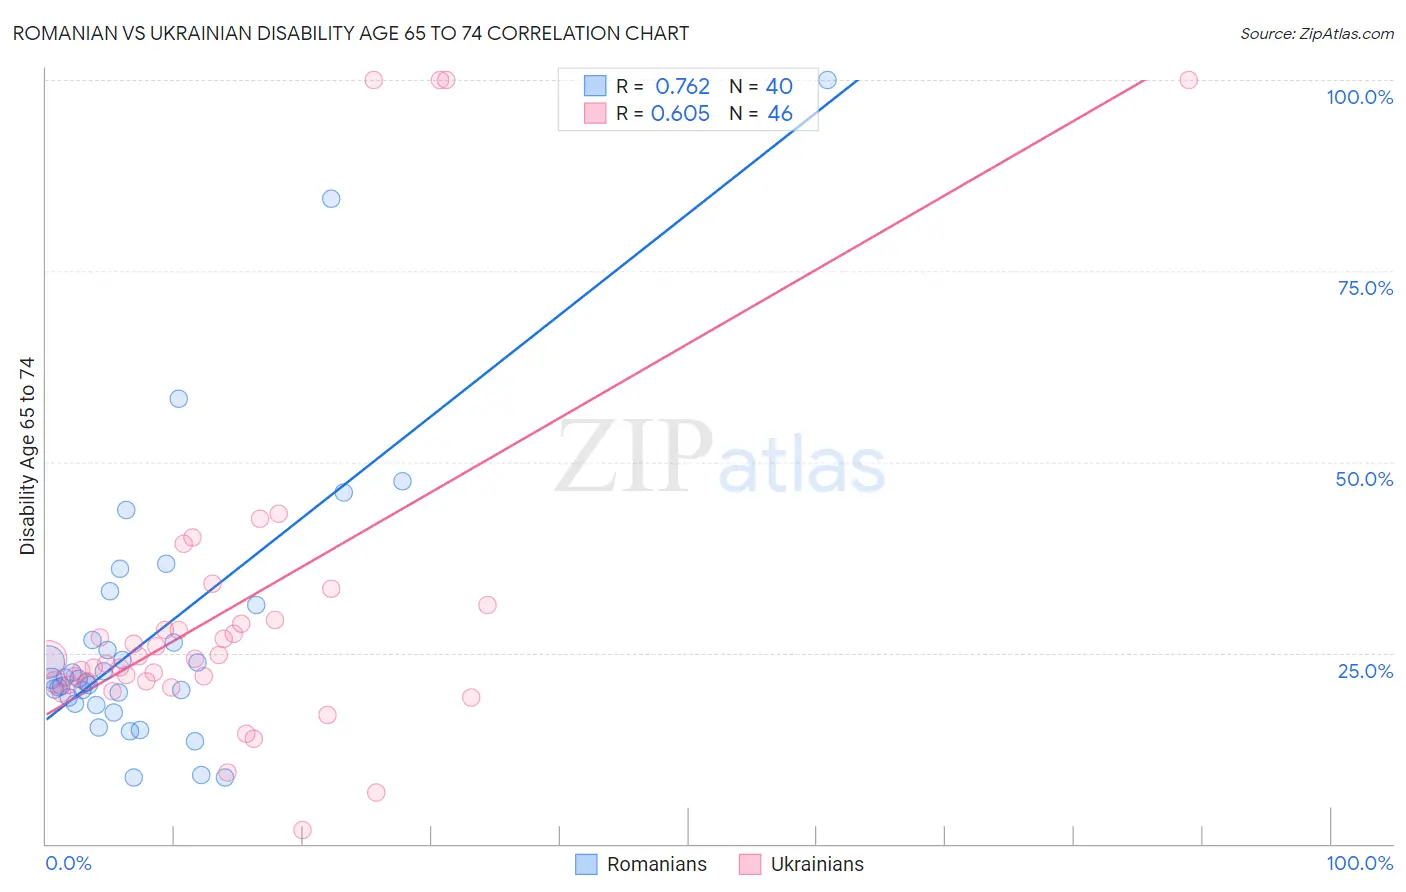
Romanian vs Ukrainian Disability Age 65 to 74 Correlation Chart
The statistical analysis conducted on geographies consisting of 377,283,716 people shows a strong positive correlation between the proportion of Romanians and percentage of population with a disability between the ages 65 and 75 in the United States with a correlation coefficient (R) of 0.762 and weighted average of 22.1%. Similarly, the statistical analysis conducted on geographies consisting of 447,594,992 people shows a significant positive correlation between the proportion of Ukrainians and percentage of population with a disability between the ages 65 and 75 in the United States with a correlation coefficient (R) of 0.605 and weighted average of 22.3%, a difference of 1.2%.
Disability Age 65 to 74 Correlation Summary
| Measurement | Romanian | Ukrainian |
| Minimum | 8.6% | 1.9% |
| Maximum | 100.0% | 100.0% |
| Range | 91.4% | 98.1% |
| Mean | 27.4% | 30.8% |
| Median | 21.6% | 24.2% |
| Interquartile 25% (IQ1) | 18.7% | 21.2% |
| Interquartile 75% (IQ3) | 29.0% | 29.3% |
| Interquartile Range (IQR) | 10.3% | 8.1% |
| Standard Deviation (Sample) | 18.5% | 23.1% |
| Standard Deviation (Population) | 18.3% | 22.8% |
Demographics Similar to Romanians and Ukrainians by Disability Age 65 to 74
In terms of disability age 65 to 74, the demographic groups most similar to Romanians are Immigrants from Chile (22.1%, a difference of 0.060%), Immigrants from North America (22.1%, a difference of 0.11%), Immigrants from Southern Europe (22.1%, a difference of 0.26%), Jordanian (22.2%, a difference of 0.47%), and Immigrants from Colombia (22.2%, a difference of 0.50%). Similarly, the demographic groups most similar to Ukrainians are Syrian (22.3%, a difference of 0.080%), Immigrants from South America (22.3%, a difference of 0.14%), Serbian (22.3%, a difference of 0.20%), Immigrants from Peru (22.3%, a difference of 0.22%), and Albanian (22.3%, a difference of 0.26%).
| Demographics | Rating | Rank | Disability Age 65 to 74 |
| Immigrants | Chile | 97.7 /100 | #94 | Exceptional 22.1% |
| Romanians | 97.7 /100 | #95 | Exceptional 22.1% |
| Immigrants | North America | 97.5 /100 | #96 | Exceptional 22.1% |
| Immigrants | Southern Europe | 97.2 /100 | #97 | Exceptional 22.1% |
| Jordanians | 96.9 /100 | #98 | Exceptional 22.2% |
| Immigrants | Colombia | 96.8 /100 | #99 | Exceptional 22.2% |
| Uruguayans | 96.5 /100 | #100 | Exceptional 22.2% |
| Immigrants | England | 96.5 /100 | #101 | Exceptional 22.2% |
| Immigrants | Saudi Arabia | 96.4 /100 | #102 | Exceptional 22.2% |
| South Americans | 96.4 /100 | #103 | Exceptional 22.2% |
| Colombians | 96.4 /100 | #104 | Exceptional 22.2% |
| Palestinians | 96.3 /100 | #105 | Exceptional 22.2% |
| Peruvians | 96.1 /100 | #106 | Exceptional 22.2% |
| Slovenes | 96.1 /100 | #107 | Exceptional 22.2% |
| Immigrants | Zimbabwe | 96.1 /100 | #108 | Exceptional 22.3% |
| Albanians | 95.8 /100 | #109 | Exceptional 22.3% |
| Immigrants | Peru | 95.7 /100 | #110 | Exceptional 22.3% |
| Serbians | 95.7 /100 | #111 | Exceptional 22.3% |
| Immigrants | South America | 95.5 /100 | #112 | Exceptional 22.3% |
| Syrians | 95.3 /100 | #113 | Exceptional 22.3% |
| Ukrainians | 95.1 /100 | #114 | Exceptional 22.3% |