Immigrants from Moldova vs U.S. Virgin Islander Disability Age 65 to 74
COMPARE
Immigrants from Moldova
U.S. Virgin Islander
Disability Age 65 to 74
Disability Age 65 to 74 Comparison
Immigrants from Moldova
U.S. Virgin Islanders
22.7%
DISABILITY AGE 65 TO 74
87.3/ 100
METRIC RATING
138th/ 347
METRIC RANK
25.9%
DISABILITY AGE 65 TO 74
0.1/ 100
METRIC RATING
279th/ 347
METRIC RANK
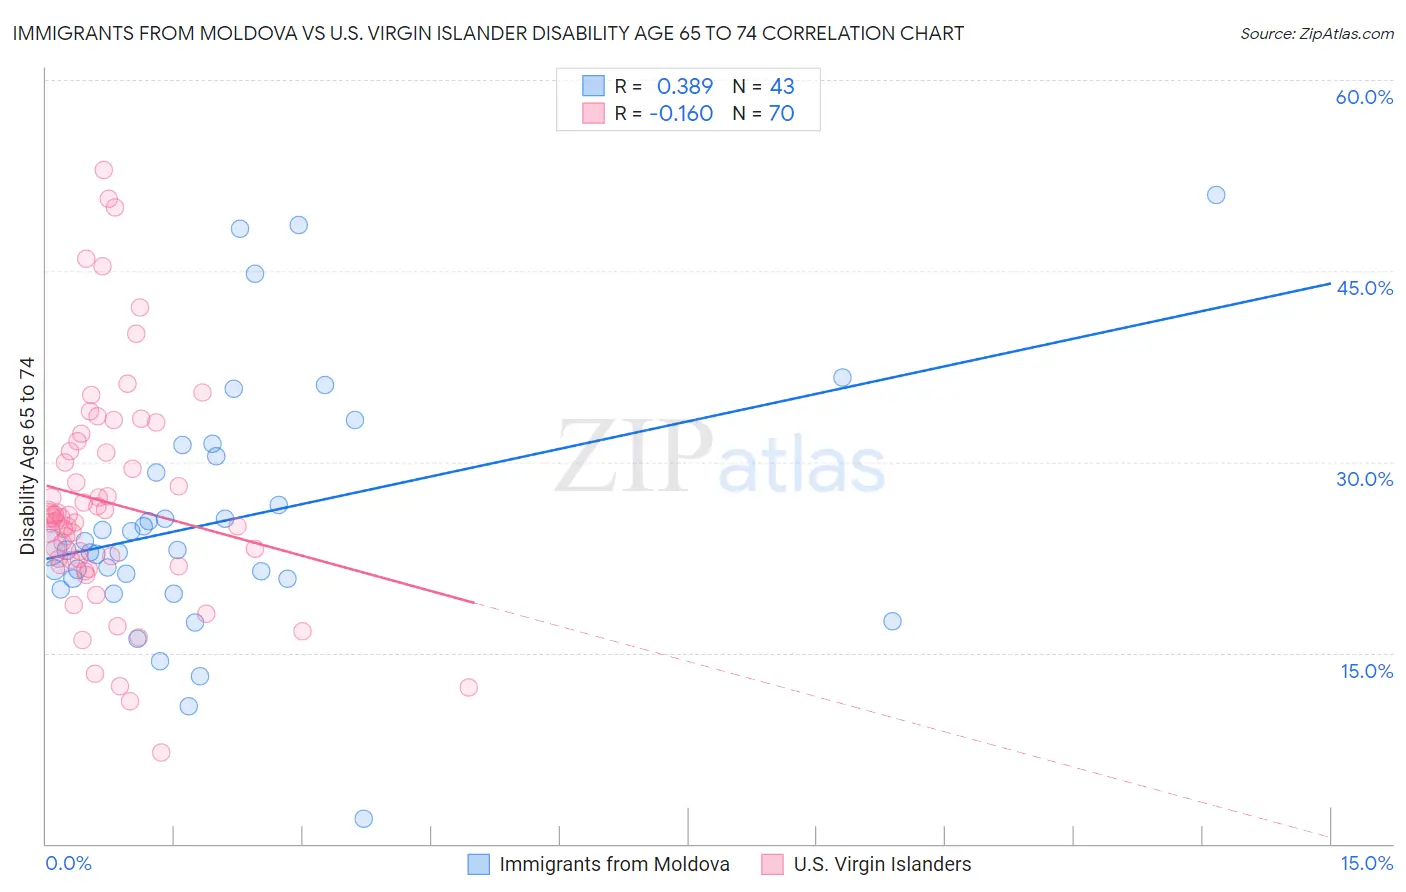
Immigrants from Moldova vs U.S. Virgin Islander Disability Age 65 to 74 Correlation Chart
The statistical analysis conducted on geographies consisting of 124,298,636 people shows a mild positive correlation between the proportion of Immigrants from Moldova and percentage of population with a disability between the ages 65 and 75 in the United States with a correlation coefficient (R) of 0.389 and weighted average of 22.7%. Similarly, the statistical analysis conducted on geographies consisting of 87,465,301 people shows a poor negative correlation between the proportion of U.S. Virgin Islanders and percentage of population with a disability between the ages 65 and 75 in the United States with a correlation coefficient (R) of -0.160 and weighted average of 25.9%, a difference of 14.0%.
Disability Age 65 to 74 Correlation Summary
| Measurement | Immigrants from Moldova | U.S. Virgin Islander |
| Minimum | 2.0% | 7.1% |
| Maximum | 50.9% | 52.9% |
| Range | 49.0% | 45.8% |
| Mean | 25.5% | 26.8% |
| Median | 23.1% | 25.6% |
| Interquartile 25% (IQ1) | 20.8% | 22.3% |
| Interquartile 75% (IQ3) | 30.4% | 30.9% |
| Interquartile Range (IQR) | 9.6% | 8.6% |
| Standard Deviation (Sample) | 9.9% | 9.0% |
| Standard Deviation (Population) | 9.8% | 9.0% |
Similar Demographics by Disability Age 65 to 74
Demographics Similar to Immigrants from Moldova by Disability Age 65 to 74
In terms of disability age 65 to 74, the demographic groups most similar to Immigrants from Moldova are Taiwanese (22.7%, a difference of 0.050%), Ethiopian (22.7%, a difference of 0.090%), Immigrants from Ukraine (22.6%, a difference of 0.15%), Afghan (22.6%, a difference of 0.19%), and Immigrants from Syria (22.7%, a difference of 0.19%).
| Demographics | Rating | Rank | Disability Age 65 to 74 |
| Immigrants | Nepal | 89.4 /100 | #131 | Excellent 22.6% |
| Costa Ricans | 89.2 /100 | #132 | Excellent 22.6% |
| Northern Europeans | 88.9 /100 | #133 | Excellent 22.6% |
| Afghans | 88.6 /100 | #134 | Excellent 22.6% |
| Immigrants | Ukraine | 88.4 /100 | #135 | Excellent 22.6% |
| Ethiopians | 87.9 /100 | #136 | Excellent 22.7% |
| Taiwanese | 87.6 /100 | #137 | Excellent 22.7% |
| Immigrants | Moldova | 87.3 /100 | #138 | Excellent 22.7% |
| Immigrants | Syria | 85.8 /100 | #139 | Excellent 22.7% |
| Ugandans | 85.4 /100 | #140 | Excellent 22.7% |
| Belgians | 85.3 /100 | #141 | Excellent 22.7% |
| Immigrants | Ethiopia | 85.3 /100 | #142 | Excellent 22.7% |
| Arabs | 84.8 /100 | #143 | Excellent 22.8% |
| Danes | 84.4 /100 | #144 | Excellent 22.8% |
| Immigrants | Uganda | 84.0 /100 | #145 | Excellent 22.8% |
Demographics Similar to U.S. Virgin Islanders by Disability Age 65 to 74
In terms of disability age 65 to 74, the demographic groups most similar to U.S. Virgin Islanders are Immigrants from Belize (25.8%, a difference of 0.080%), Cree (25.9%, a difference of 0.080%), Belizean (25.8%, a difference of 0.10%), Immigrants from Honduras (25.9%, a difference of 0.10%), and Delaware (25.9%, a difference of 0.18%).
| Demographics | Rating | Rank | Disability Age 65 to 74 |
| Immigrants | Dominica | 0.1 /100 | #272 | Tragic 25.7% |
| Japanese | 0.1 /100 | #273 | Tragic 25.7% |
| Americans | 0.1 /100 | #274 | Tragic 25.8% |
| Hondurans | 0.1 /100 | #275 | Tragic 25.8% |
| French American Indians | 0.1 /100 | #276 | Tragic 25.8% |
| Belizeans | 0.1 /100 | #277 | Tragic 25.8% |
| Immigrants | Belize | 0.1 /100 | #278 | Tragic 25.8% |
| U.S. Virgin Islanders | 0.1 /100 | #279 | Tragic 25.9% |
| Cree | 0.1 /100 | #280 | Tragic 25.9% |
| Immigrants | Honduras | 0.1 /100 | #281 | Tragic 25.9% |
| Delaware | 0.1 /100 | #282 | Tragic 25.9% |
| Spanish Americans | 0.0 /100 | #283 | Tragic 25.9% |
| Immigrants | Azores | 0.0 /100 | #284 | Tragic 26.0% |
| Immigrants | Congo | 0.0 /100 | #285 | Tragic 26.0% |
| Immigrants | Micronesia | 0.0 /100 | #286 | Tragic 26.1% |