Romanian vs Bhutanese Hearing Disability
COMPARE
Romanian
Bhutanese
Hearing Disability
Hearing Disability Comparison
Romanians
Bhutanese
3.1%
HEARING DISABILITY
12.1/ 100
METRIC RATING
211th/ 347
METRIC RANK
3.2%
HEARING DISABILITY
4.6/ 100
METRIC RATING
227th/ 347
METRIC RANK
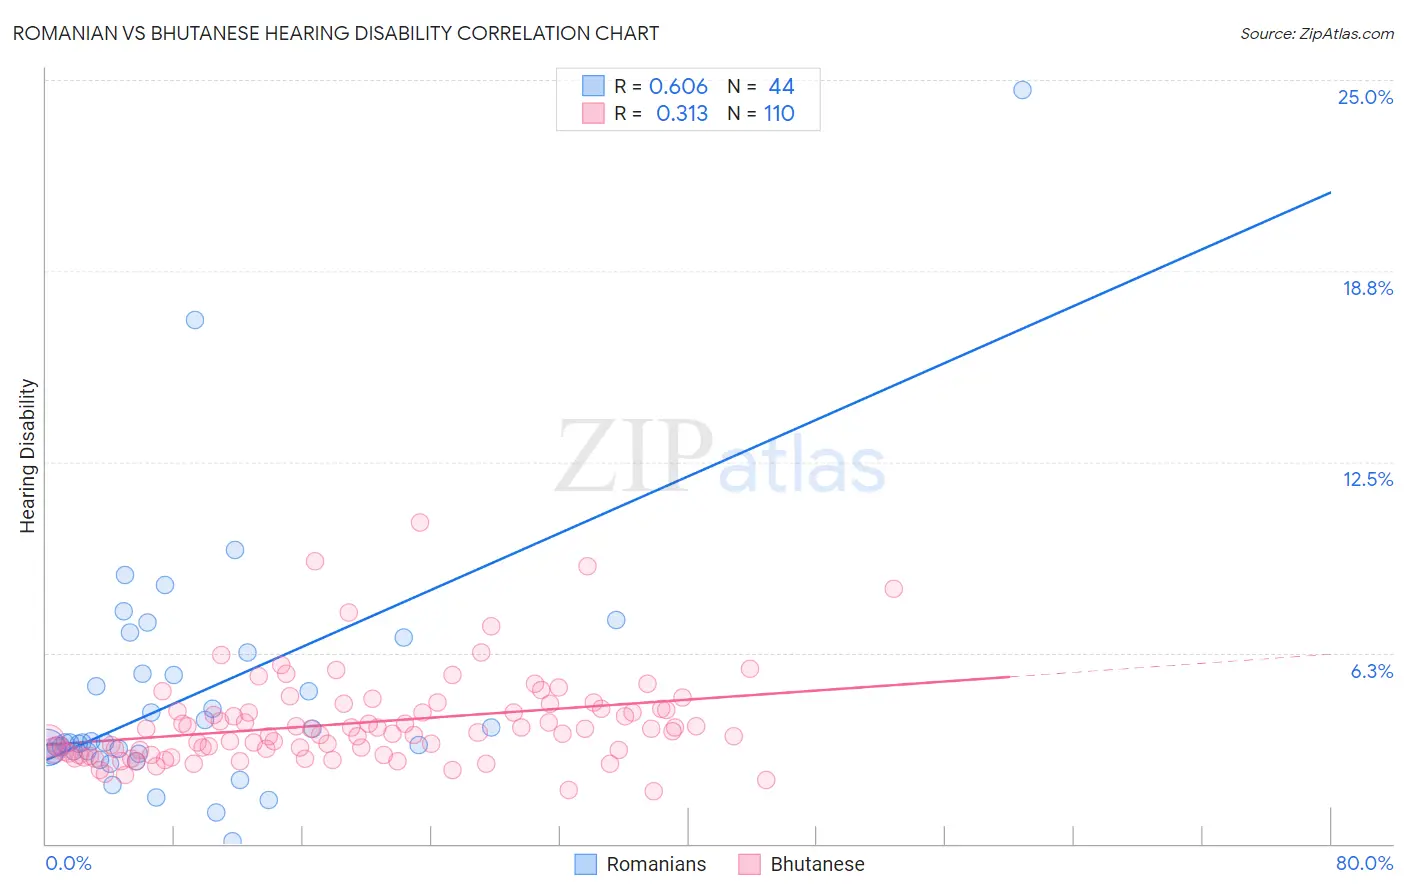
Romanian vs Bhutanese Hearing Disability Correlation Chart
The statistical analysis conducted on geographies consisting of 377,801,954 people shows a significant positive correlation between the proportion of Romanians and percentage of population with hearing disability in the United States with a correlation coefficient (R) of 0.606 and weighted average of 3.1%. Similarly, the statistical analysis conducted on geographies consisting of 455,292,805 people shows a mild positive correlation between the proportion of Bhutanese and percentage of population with hearing disability in the United States with a correlation coefficient (R) of 0.313 and weighted average of 3.2%, a difference of 2.3%.
Hearing Disability Correlation Summary
| Measurement | Romanian | Bhutanese |
| Minimum | 0.091% | 1.7% |
| Maximum | 24.7% | 10.5% |
| Range | 24.6% | 8.8% |
| Mean | 4.9% | 4.0% |
| Median | 3.3% | 3.7% |
| Interquartile 25% (IQ1) | 3.0% | 3.0% |
| Interquartile 75% (IQ3) | 5.9% | 4.4% |
| Interquartile Range (IQR) | 2.9% | 1.5% |
| Standard Deviation (Sample) | 4.2% | 1.5% |
| Standard Deviation (Population) | 4.2% | 1.5% |
Demographics Similar to Romanians and Bhutanese by Hearing Disability
In terms of hearing disability, the demographic groups most similar to Romanians are Cape Verdean (3.1%, a difference of 0.040%), Immigrants from Hungary (3.1%, a difference of 0.080%), Pakistani (3.1%, a difference of 0.21%), Immigrants from Iraq (3.1%, a difference of 0.36%), and Australian (3.2%, a difference of 0.98%). Similarly, the demographic groups most similar to Bhutanese are Lebanese (3.2%, a difference of 0.18%), Immigrants from Portugal (3.2%, a difference of 0.20%), Latvian (3.2%, a difference of 0.23%), Icelander (3.2%, a difference of 0.27%), and Maltese (3.2%, a difference of 0.30%).
| Demographics | Rating | Rank | Hearing Disability |
| Immigrants | Hungary | 12.5 /100 | #209 | Poor 3.1% |
| Cape Verdeans | 12.2 /100 | #210 | Poor 3.1% |
| Romanians | 12.1 /100 | #211 | Poor 3.1% |
| Pakistanis | 11.1 /100 | #212 | Poor 3.1% |
| Immigrants | Iraq | 10.5 /100 | #213 | Poor 3.1% |
| Australians | 8.1 /100 | #214 | Tragic 3.2% |
| Bangladeshis | 8.1 /100 | #215 | Tragic 3.2% |
| Immigrants | Norway | 7.3 /100 | #216 | Tragic 3.2% |
| Russians | 7.1 /100 | #217 | Tragic 3.2% |
| Immigrants | Northern Europe | 7.0 /100 | #218 | Tragic 3.2% |
| New Zealanders | 6.8 /100 | #219 | Tragic 3.2% |
| Malaysians | 6.6 /100 | #220 | Tragic 3.2% |
| Immigrants | Laos | 6.6 /100 | #221 | Tragic 3.2% |
| Immigrants | Oceania | 6.5 /100 | #222 | Tragic 3.2% |
| Mexicans | 5.6 /100 | #223 | Tragic 3.2% |
| Icelanders | 5.2 /100 | #224 | Tragic 3.2% |
| Latvians | 5.1 /100 | #225 | Tragic 3.2% |
| Lebanese | 5.0 /100 | #226 | Tragic 3.2% |
| Bhutanese | 4.6 /100 | #227 | Tragic 3.2% |
| Immigrants | Portugal | 4.3 /100 | #228 | Tragic 3.2% |
| Maltese | 4.1 /100 | #229 | Tragic 3.2% |