Puerto Rican vs Shoshone Disability Age 5 to 17
COMPARE
Puerto Rican
Shoshone
Disability Age 5 to 17
Disability Age 5 to 17 Comparison
Puerto Ricans
Shoshone
8.3%
DISABILITY AGE 5 TO 17
0.0/ 100
METRIC RATING
346th/ 347
METRIC RANK
5.6%
DISABILITY AGE 5 TO 17
49.4/ 100
METRIC RATING
175th/ 347
METRIC RANK
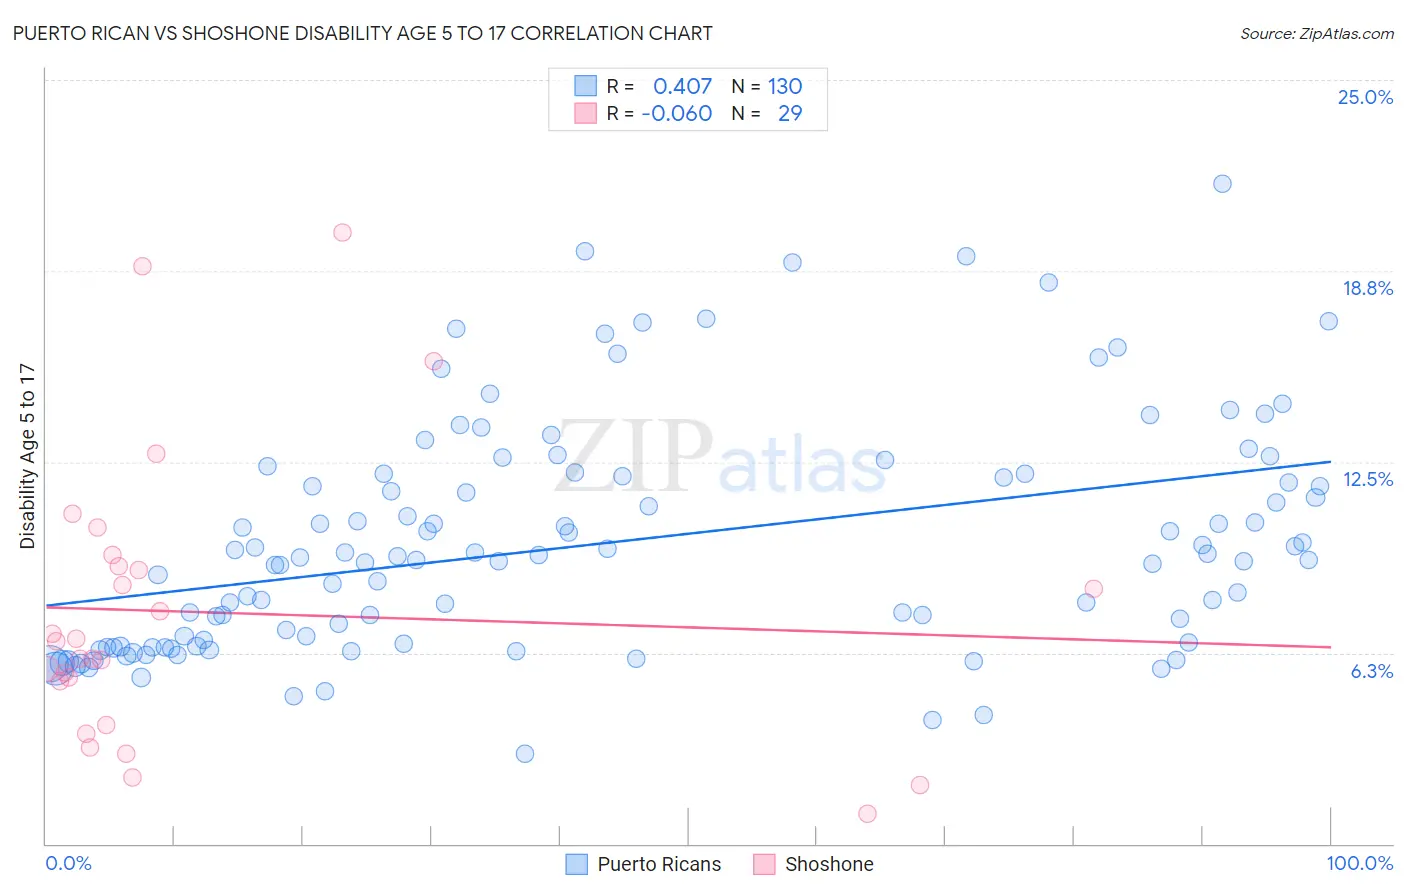
Puerto Rican vs Shoshone Disability Age 5 to 17 Correlation Chart
The statistical analysis conducted on geographies consisting of 520,259,876 people shows a moderate positive correlation between the proportion of Puerto Ricans and percentage of population with a disability between the ages 5 and 17 in the United States with a correlation coefficient (R) of 0.407 and weighted average of 8.3%. Similarly, the statistical analysis conducted on geographies consisting of 66,499,721 people shows a slight negative correlation between the proportion of Shoshone and percentage of population with a disability between the ages 5 and 17 in the United States with a correlation coefficient (R) of -0.060 and weighted average of 5.6%, a difference of 47.9%.
Disability Age 5 to 17 Correlation Summary
| Measurement | Puerto Rican | Shoshone |
| Minimum | 3.0% | 0.97% |
| Maximum | 21.6% | 20.0% |
| Range | 18.7% | 19.0% |
| Mean | 9.8% | 7.6% |
| Median | 9.3% | 6.6% |
| Interquartile 25% (IQ1) | 6.5% | 4.6% |
| Interquartile 75% (IQ3) | 12.0% | 9.3% |
| Interquartile Range (IQR) | 5.6% | 4.7% |
| Standard Deviation (Sample) | 3.8% | 4.7% |
| Standard Deviation (Population) | 3.7% | 4.6% |
Similar Demographics by Disability Age 5 to 17
Demographics Similar to Puerto Ricans by Disability Age 5 to 17
In terms of disability age 5 to 17, the demographic groups most similar to Puerto Ricans are Tsimshian (7.9%, a difference of 4.4%), Houma (9.1%, a difference of 9.3%), Cajun (7.2%, a difference of 15.3%), Immigrants from Cabo Verde (7.1%, a difference of 16.2%), and Chippewa (7.1%, a difference of 16.5%).
| Demographics | Rating | Rank | Disability Age 5 to 17 |
| Blacks/African Americans | 0.0 /100 | #333 | Tragic 6.8% |
| Seminole | 0.0 /100 | #334 | Tragic 6.8% |
| Ottawa | 0.0 /100 | #335 | Tragic 6.8% |
| Chickasaw | 0.0 /100 | #336 | Tragic 6.8% |
| Creek | 0.0 /100 | #337 | Tragic 6.9% |
| Iroquois | 0.0 /100 | #338 | Tragic 6.9% |
| Choctaw | 0.0 /100 | #339 | Tragic 6.9% |
| Cherokee | 0.0 /100 | #340 | Tragic 6.9% |
| Cape Verdeans | 0.0 /100 | #341 | Tragic 7.0% |
| Chippewa | 0.0 /100 | #342 | Tragic 7.1% |
| Immigrants | Cabo Verde | 0.0 /100 | #343 | Tragic 7.1% |
| Cajuns | 0.0 /100 | #344 | Tragic 7.2% |
| Tsimshian | 0.0 /100 | #345 | Tragic 7.9% |
| Puerto Ricans | 0.0 /100 | #346 | Tragic 8.3% |
| Houma | 0.0 /100 | #347 | Tragic 9.1% |
Demographics Similar to Shoshone by Disability Age 5 to 17
In terms of disability age 5 to 17, the demographic groups most similar to Shoshone are Immigrants from Central America (5.6%, a difference of 0.0%), Costa Rican (5.6%, a difference of 0.030%), Uruguayan (5.6%, a difference of 0.080%), Immigrants from Western Europe (5.6%, a difference of 0.080%), and Immigrants from Trinidad and Tobago (5.6%, a difference of 0.090%).
| Demographics | Rating | Rank | Disability Age 5 to 17 |
| Iraqis | 56.0 /100 | #168 | Average 5.6% |
| Immigrants | Norway | 55.7 /100 | #169 | Average 5.6% |
| Serbians | 54.0 /100 | #170 | Average 5.6% |
| Immigrants | Iraq | 53.9 /100 | #171 | Average 5.6% |
| Ukrainians | 51.5 /100 | #172 | Average 5.6% |
| Uruguayans | 51.0 /100 | #173 | Average 5.6% |
| Costa Ricans | 50.0 /100 | #174 | Average 5.6% |
| Shoshone | 49.4 /100 | #175 | Average 5.6% |
| Immigrants | Central America | 49.4 /100 | #176 | Average 5.6% |
| Immigrants | Western Europe | 47.8 /100 | #177 | Average 5.6% |
| Immigrants | Trinidad and Tobago | 47.6 /100 | #178 | Average 5.6% |
| Immigrants | Barbados | 40.5 /100 | #179 | Average 5.6% |
| Immigrants | Uruguay | 37.7 /100 | #180 | Fair 5.6% |
| Immigrants | England | 36.4 /100 | #181 | Fair 5.6% |
| Mexican American Indians | 35.2 /100 | #182 | Fair 5.6% |