Immigrants from Hungary vs Cypriot Hearing Disability
COMPARE
Immigrants from Hungary
Cypriot
Hearing Disability
Hearing Disability Comparison
Immigrants from Hungary
Cypriots
3.1%
HEARING DISABILITY
12.5/ 100
METRIC RATING
209th/ 347
METRIC RANK
2.8%
HEARING DISABILITY
92.9/ 100
METRIC RATING
110th/ 347
METRIC RANK
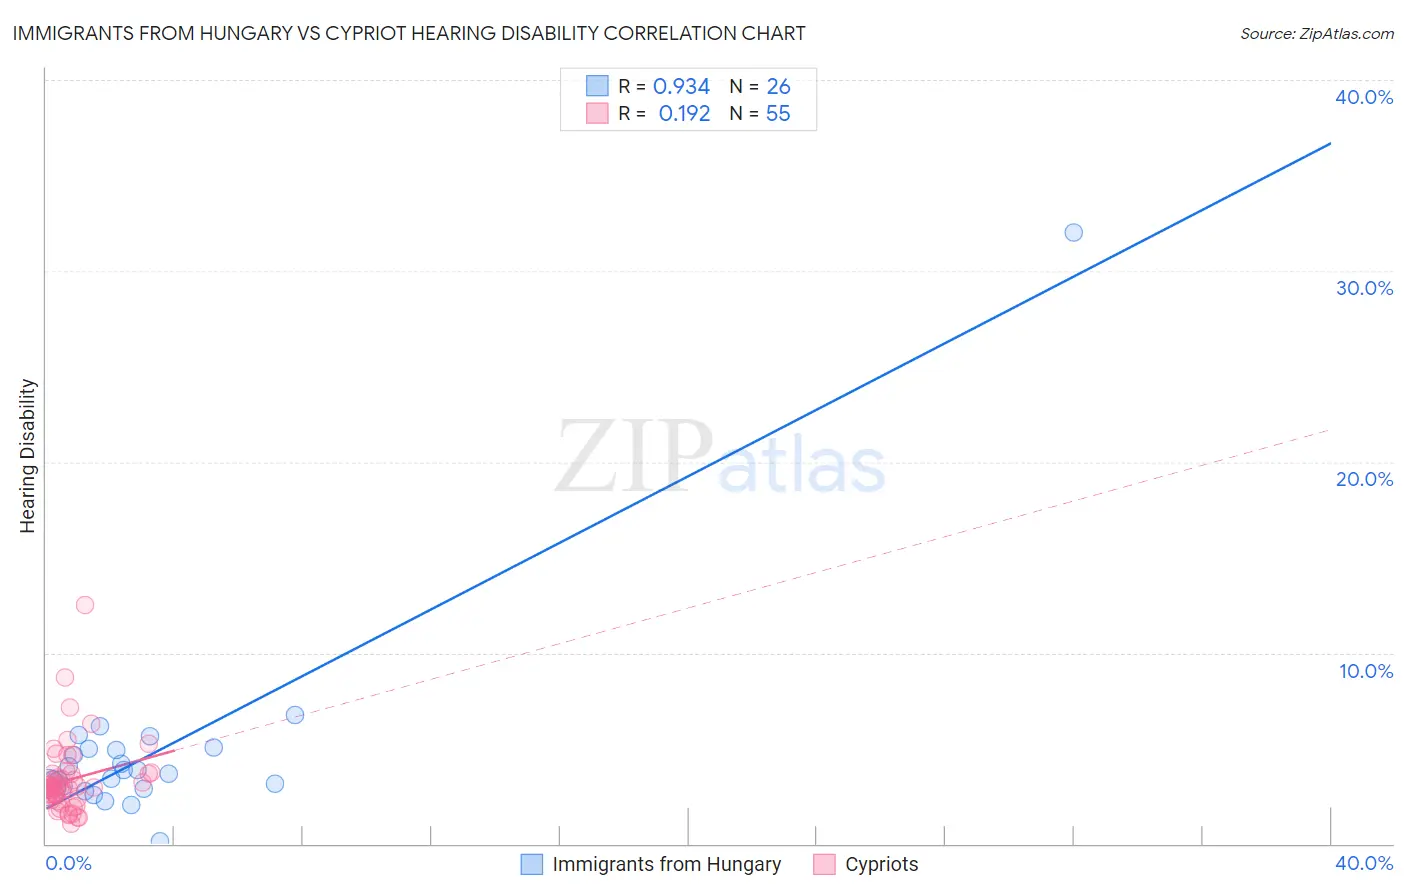
Immigrants from Hungary vs Cypriot Hearing Disability Correlation Chart
The statistical analysis conducted on geographies consisting of 195,680,611 people shows a near-perfect positive correlation between the proportion of Immigrants from Hungary and percentage of population with hearing disability in the United States with a correlation coefficient (R) of 0.934 and weighted average of 3.1%. Similarly, the statistical analysis conducted on geographies consisting of 61,868,814 people shows a poor positive correlation between the proportion of Cypriots and percentage of population with hearing disability in the United States with a correlation coefficient (R) of 0.192 and weighted average of 2.8%, a difference of 11.3%.
Hearing Disability Correlation Summary
| Measurement | Immigrants from Hungary | Cypriot |
| Minimum | 0.15% | 1.1% |
| Maximum | 32.0% | 12.5% |
| Range | 31.9% | 11.4% |
| Mean | 4.9% | 3.3% |
| Median | 3.8% | 3.0% |
| Interquartile 25% (IQ1) | 2.9% | 2.4% |
| Interquartile 75% (IQ3) | 5.0% | 3.7% |
| Interquartile Range (IQR) | 2.0% | 1.3% |
| Standard Deviation (Sample) | 5.7% | 1.9% |
| Standard Deviation (Population) | 5.6% | 1.9% |
Similar Demographics by Hearing Disability
Demographics Similar to Immigrants from Hungary by Hearing Disability
In terms of hearing disability, the demographic groups most similar to Immigrants from Hungary are Immigrants from Latvia (3.1%, a difference of 0.040%), Cape Verdean (3.1%, a difference of 0.050%), Romanian (3.1%, a difference of 0.080%), Pakistani (3.1%, a difference of 0.29%), and Immigrants from Iraq (3.1%, a difference of 0.44%).
| Demographics | Rating | Rank | Hearing Disability |
| Immigrants | Thailand | 16.4 /100 | #202 | Poor 3.1% |
| Immigrants | Denmark | 16.2 /100 | #203 | Poor 3.1% |
| Immigrants | Czechoslovakia | 15.9 /100 | #204 | Poor 3.1% |
| Alsatians | 15.9 /100 | #205 | Poor 3.1% |
| Eastern Europeans | 15.5 /100 | #206 | Poor 3.1% |
| Hispanics or Latinos | 15.1 /100 | #207 | Poor 3.1% |
| Immigrants | Latvia | 12.7 /100 | #208 | Poor 3.1% |
| Immigrants | Hungary | 12.5 /100 | #209 | Poor 3.1% |
| Cape Verdeans | 12.2 /100 | #210 | Poor 3.1% |
| Romanians | 12.1 /100 | #211 | Poor 3.1% |
| Pakistanis | 11.1 /100 | #212 | Poor 3.1% |
| Immigrants | Iraq | 10.5 /100 | #213 | Poor 3.1% |
| Australians | 8.1 /100 | #214 | Tragic 3.2% |
| Bangladeshis | 8.1 /100 | #215 | Tragic 3.2% |
| Immigrants | Norway | 7.3 /100 | #216 | Tragic 3.2% |
Demographics Similar to Cypriots by Hearing Disability
In terms of hearing disability, the demographic groups most similar to Cypriots are Turkish (2.8%, a difference of 0.050%), Immigrants from Yemen (2.8%, a difference of 0.050%), Guatemalan (2.8%, a difference of 0.12%), U.S. Virgin Islander (2.8%, a difference of 0.12%), and Honduran (2.8%, a difference of 0.20%).
| Demographics | Rating | Rank | Hearing Disability |
| Immigrants | Indonesia | 94.7 /100 | #103 | Exceptional 2.8% |
| Burmese | 94.2 /100 | #104 | Exceptional 2.8% |
| Moroccans | 93.9 /100 | #105 | Exceptional 2.8% |
| Hondurans | 93.4 /100 | #106 | Exceptional 2.8% |
| Immigrants | Chile | 93.4 /100 | #107 | Exceptional 2.8% |
| Guatemalans | 93.2 /100 | #108 | Exceptional 2.8% |
| Turks | 93.0 /100 | #109 | Exceptional 2.8% |
| Cypriots | 92.9 /100 | #110 | Exceptional 2.8% |
| Immigrants | Yemen | 92.7 /100 | #111 | Exceptional 2.8% |
| U.S. Virgin Islanders | 92.5 /100 | #112 | Exceptional 2.8% |
| Immigrants | Belarus | 91.6 /100 | #113 | Exceptional 2.8% |
| Cambodians | 91.1 /100 | #114 | Exceptional 2.8% |
| Immigrants | Latin America | 90.5 /100 | #115 | Exceptional 2.8% |
| Immigrants | Immigrants | 90.3 /100 | #116 | Exceptional 2.8% |
| Immigrants | Liberia | 90.0 /100 | #117 | Excellent 2.8% |