Pima vs Costa Rican Disability Age 18 to 34
COMPARE
Pima
Costa Rican
Disability Age 18 to 34
Disability Age 18 to 34 Comparison
Pima
Costa Ricans
7.7%
DISABILITY AGE 18 TO 34
0.0/ 100
METRIC RATING
301st/ 347
METRIC RANK
6.3%
DISABILITY AGE 18 TO 34
92.9/ 100
METRIC RATING
123rd/ 347
METRIC RANK
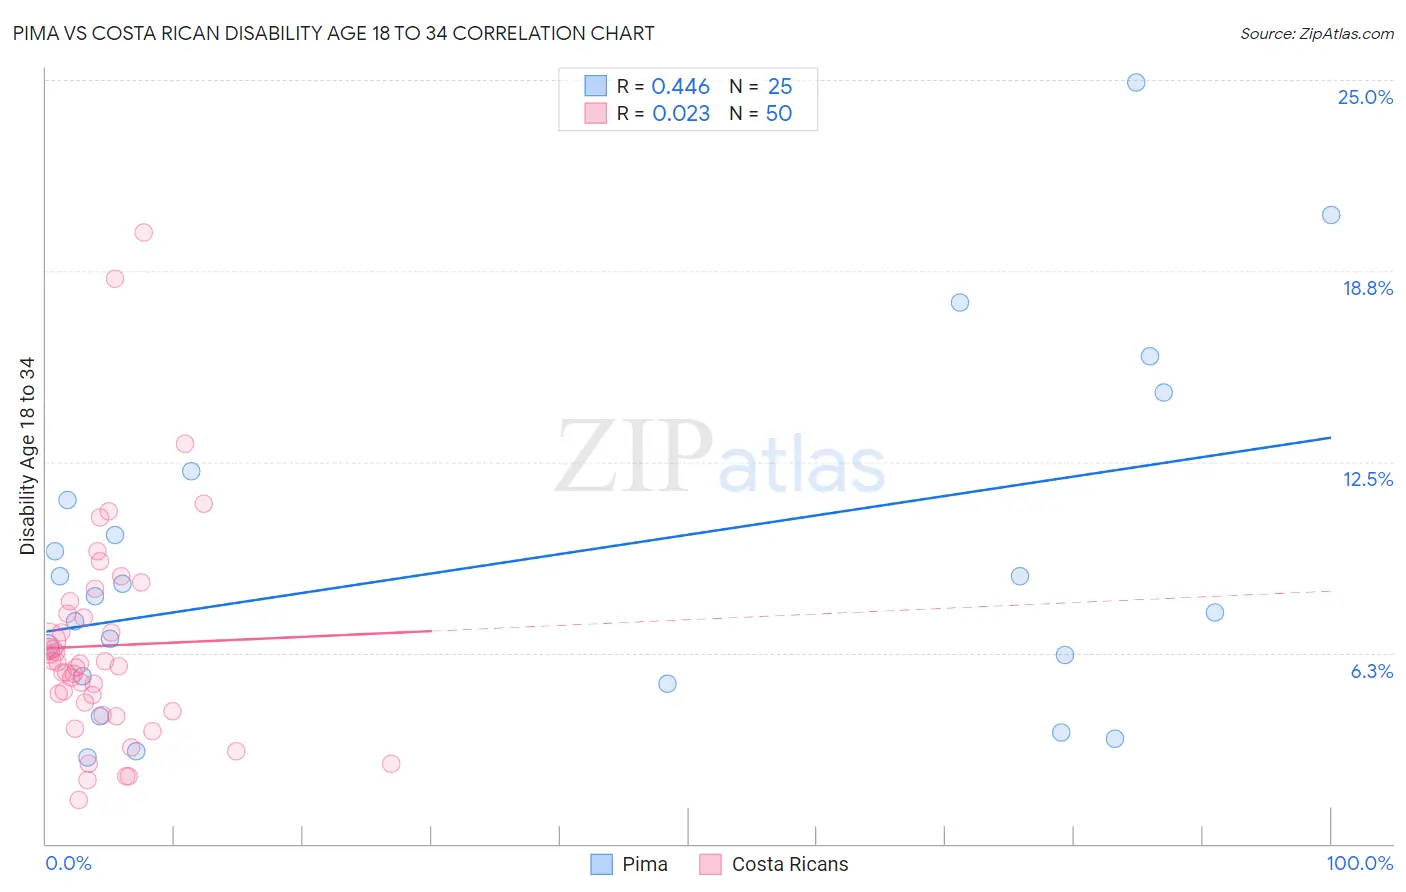
Pima vs Costa Rican Disability Age 18 to 34 Correlation Chart
The statistical analysis conducted on geographies consisting of 61,478,935 people shows a moderate positive correlation between the proportion of Pima and percentage of population with a disability between the ages 18 and 35 in the United States with a correlation coefficient (R) of 0.446 and weighted average of 7.7%. Similarly, the statistical analysis conducted on geographies consisting of 253,342,292 people shows no correlation between the proportion of Costa Ricans and percentage of population with a disability between the ages 18 and 35 in the United States with a correlation coefficient (R) of 0.023 and weighted average of 6.3%, a difference of 22.7%.
Disability Age 18 to 34 Correlation Summary
| Measurement | Pima | Costa Rican |
| Minimum | 2.8% | 1.4% |
| Maximum | 24.9% | 20.0% |
| Range | 22.1% | 18.6% |
| Mean | 9.3% | 6.5% |
| Median | 8.1% | 5.9% |
| Interquartile 25% (IQ1) | 5.3% | 4.3% |
| Interquartile 75% (IQ3) | 11.7% | 7.5% |
| Interquartile Range (IQR) | 6.4% | 3.2% |
| Standard Deviation (Sample) | 5.7% | 3.6% |
| Standard Deviation (Population) | 5.5% | 3.6% |
Similar Demographics by Disability Age 18 to 34
Demographics Similar to Pima by Disability Age 18 to 34
In terms of disability age 18 to 34, the demographic groups most similar to Pima are Scottish (7.7%, a difference of 0.060%), Welsh (7.7%, a difference of 0.070%), German (7.7%, a difference of 0.080%), Cheyenne (7.7%, a difference of 0.14%), and Dutch (7.7%, a difference of 0.31%).
| Demographics | Rating | Rank | Disability Age 18 to 34 |
| Immigrants | Cabo Verde | 0.0 /100 | #294 | Tragic 7.7% |
| Tlingit-Haida | 0.0 /100 | #295 | Tragic 7.7% |
| Cape Verdeans | 0.0 /100 | #296 | Tragic 7.7% |
| Pueblo | 0.0 /100 | #297 | Tragic 7.7% |
| Dutch | 0.0 /100 | #298 | Tragic 7.7% |
| Germans | 0.0 /100 | #299 | Tragic 7.7% |
| Scottish | 0.0 /100 | #300 | Tragic 7.7% |
| Pima | 0.0 /100 | #301 | Tragic 7.7% |
| Welsh | 0.0 /100 | #302 | Tragic 7.7% |
| Cheyenne | 0.0 /100 | #303 | Tragic 7.7% |
| Shoshone | 0.0 /100 | #304 | Tragic 7.8% |
| Menominee | 0.0 /100 | #305 | Tragic 7.8% |
| English | 0.0 /100 | #306 | Tragic 7.8% |
| Scotch-Irish | 0.0 /100 | #307 | Tragic 7.8% |
| Pennsylvania Germans | 0.0 /100 | #308 | Tragic 7.8% |
Demographics Similar to Costa Ricans by Disability Age 18 to 34
In terms of disability age 18 to 34, the demographic groups most similar to Costa Ricans are Immigrants from Morocco (6.3%, a difference of 0.020%), Macedonian (6.3%, a difference of 0.080%), Immigrants from Czechoslovakia (6.3%, a difference of 0.11%), Immigrants from Switzerland (6.3%, a difference of 0.11%), and Immigrants from Guatemala (6.3%, a difference of 0.12%).
| Demographics | Rating | Rank | Disability Age 18 to 34 |
| Immigrants | Costa Rica | 94.0 /100 | #116 | Exceptional 6.3% |
| Immigrants | Jordan | 94.0 /100 | #117 | Exceptional 6.3% |
| Immigrants | Nepal | 93.7 /100 | #118 | Exceptional 6.3% |
| Chileans | 93.5 /100 | #119 | Exceptional 6.3% |
| Immigrants | Ukraine | 93.4 /100 | #120 | Exceptional 6.3% |
| Immigrants | Guatemala | 93.4 /100 | #121 | Exceptional 6.3% |
| Immigrants | Czechoslovakia | 93.3 /100 | #122 | Exceptional 6.3% |
| Costa Ricans | 92.9 /100 | #123 | Exceptional 6.3% |
| Immigrants | Morocco | 92.9 /100 | #124 | Exceptional 6.3% |
| Macedonians | 92.6 /100 | #125 | Exceptional 6.3% |
| Immigrants | Switzerland | 92.5 /100 | #126 | Exceptional 6.3% |
| West Indians | 92.0 /100 | #127 | Exceptional 6.3% |
| Chinese | 91.9 /100 | #128 | Exceptional 6.3% |
| Immigrants | Italy | 90.5 /100 | #129 | Exceptional 6.3% |
| Immigrants | Dominica | 90.5 /100 | #130 | Exceptional 6.3% |