Peruvian vs Honduran Disability Age 18 to 34
COMPARE
Peruvian
Honduran
Disability Age 18 to 34
Disability Age 18 to 34 Comparison
Peruvians
Hondurans
6.0%
DISABILITY AGE 18 TO 34
99.6/ 100
METRIC RATING
62nd/ 347
METRIC RANK
6.4%
DISABILITY AGE 18 TO 34
83.1/ 100
METRIC RATING
149th/ 347
METRIC RANK
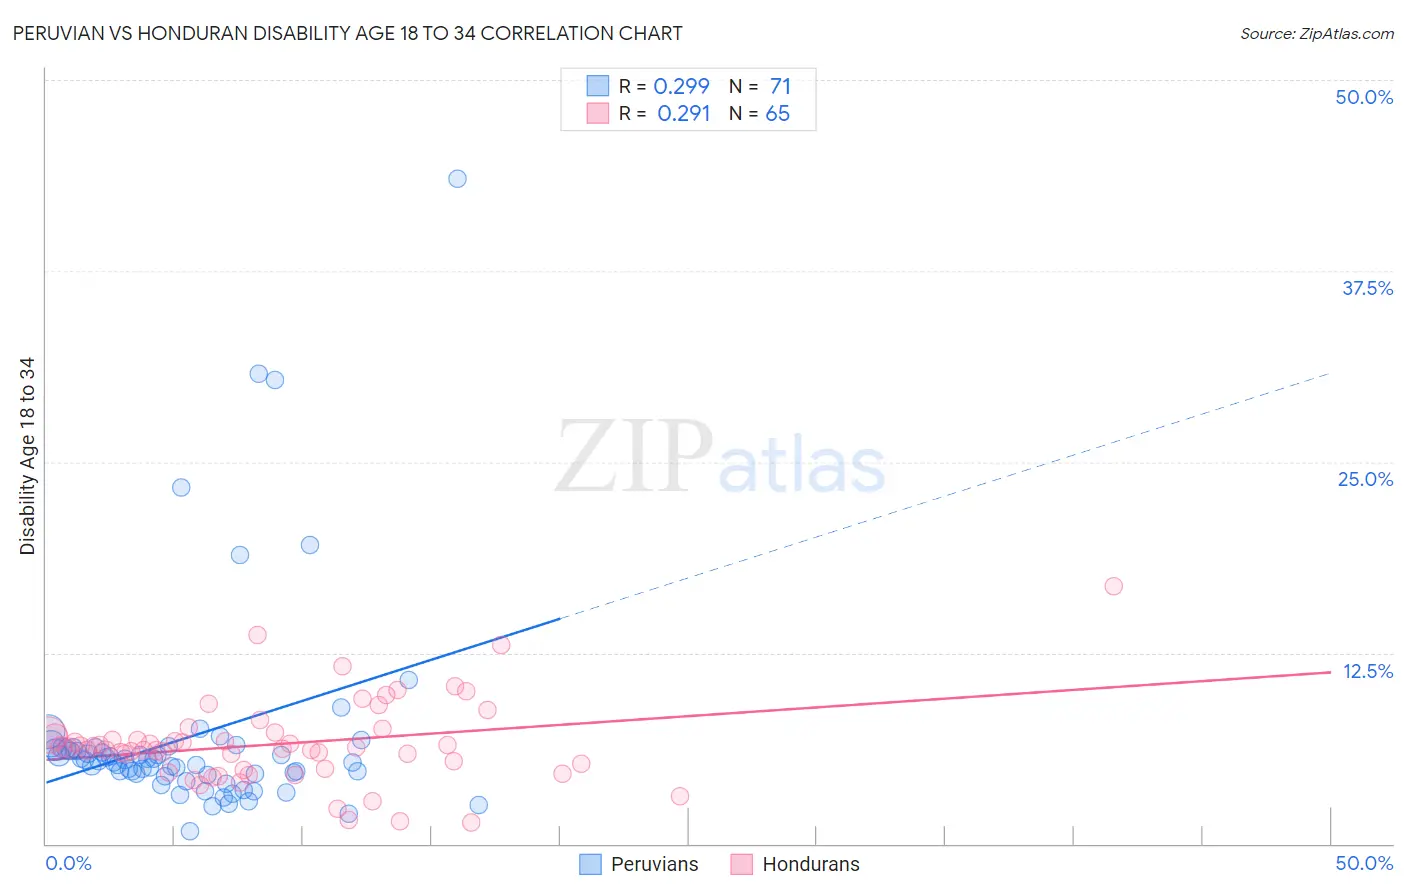
Peruvian vs Honduran Disability Age 18 to 34 Correlation Chart
The statistical analysis conducted on geographies consisting of 362,638,552 people shows a weak positive correlation between the proportion of Peruvians and percentage of population with a disability between the ages 18 and 35 in the United States with a correlation coefficient (R) of 0.299 and weighted average of 6.0%. Similarly, the statistical analysis conducted on geographies consisting of 357,370,042 people shows a weak positive correlation between the proportion of Hondurans and percentage of population with a disability between the ages 18 and 35 in the United States with a correlation coefficient (R) of 0.291 and weighted average of 6.4%, a difference of 7.4%.
Disability Age 18 to 34 Correlation Summary
| Measurement | Peruvian | Honduran |
| Minimum | 0.85% | 1.4% |
| Maximum | 43.5% | 16.9% |
| Range | 42.7% | 15.5% |
| Mean | 7.0% | 6.5% |
| Median | 5.4% | 6.3% |
| Interquartile 25% (IQ1) | 4.5% | 4.9% |
| Interquartile 75% (IQ3) | 6.3% | 7.2% |
| Interquartile Range (IQR) | 1.8% | 2.3% |
| Standard Deviation (Sample) | 7.0% | 2.8% |
| Standard Deviation (Population) | 6.9% | 2.7% |
Similar Demographics by Disability Age 18 to 34
Demographics Similar to Peruvians by Disability Age 18 to 34
In terms of disability age 18 to 34, the demographic groups most similar to Peruvians are British West Indian (6.0%, a difference of 0.030%), Salvadoran (6.0%, a difference of 0.050%), Taiwanese (6.0%, a difference of 0.070%), Trinidadian and Tobagonian (6.0%, a difference of 0.21%), and Immigrants from Sri Lanka (6.0%, a difference of 0.28%).
| Demographics | Rating | Rank | Disability Age 18 to 34 |
| Immigrants | Spain | 99.7 /100 | #55 | Exceptional 5.9% |
| Paraguayans | 99.7 /100 | #56 | Exceptional 5.9% |
| Immigrants | Haiti | 99.7 /100 | #57 | Exceptional 5.9% |
| Immigrants | Serbia | 99.7 /100 | #58 | Exceptional 5.9% |
| Immigrants | Caribbean | 99.6 /100 | #59 | Exceptional 6.0% |
| Immigrants | Sri Lanka | 99.6 /100 | #60 | Exceptional 6.0% |
| British West Indians | 99.6 /100 | #61 | Exceptional 6.0% |
| Peruvians | 99.6 /100 | #62 | Exceptional 6.0% |
| Salvadorans | 99.6 /100 | #63 | Exceptional 6.0% |
| Taiwanese | 99.6 /100 | #64 | Exceptional 6.0% |
| Trinidadians and Tobagonians | 99.5 /100 | #65 | Exceptional 6.0% |
| Burmese | 99.5 /100 | #66 | Exceptional 6.0% |
| Immigrants | North Macedonia | 99.5 /100 | #67 | Exceptional 6.0% |
| Immigrants | Poland | 99.5 /100 | #68 | Exceptional 6.0% |
| Immigrants | West Indies | 99.4 /100 | #69 | Exceptional 6.0% |
Demographics Similar to Hondurans by Disability Age 18 to 34
In terms of disability age 18 to 34, the demographic groups most similar to Hondurans are Immigrants from Dominican Republic (6.4%, a difference of 0.040%), Immigrants from Belgium (6.4%, a difference of 0.060%), Immigrants from South Africa (6.4%, a difference of 0.070%), Tongan (6.4%, a difference of 0.15%), and Belizean (6.4%, a difference of 0.24%).
| Demographics | Rating | Rank | Disability Age 18 to 34 |
| South American Indians | 86.5 /100 | #142 | Excellent 6.4% |
| Immigrants | Latvia | 86.4 /100 | #143 | Excellent 6.4% |
| Albanians | 85.3 /100 | #144 | Excellent 6.4% |
| Moroccans | 85.2 /100 | #145 | Excellent 6.4% |
| Belizeans | 84.9 /100 | #146 | Excellent 6.4% |
| Immigrants | South Africa | 83.7 /100 | #147 | Excellent 6.4% |
| Immigrants | Belgium | 83.5 /100 | #148 | Excellent 6.4% |
| Hondurans | 83.1 /100 | #149 | Excellent 6.4% |
| Immigrants | Dominican Republic | 82.7 /100 | #150 | Excellent 6.4% |
| Tongans | 81.9 /100 | #151 | Excellent 6.4% |
| Bulgarians | 78.3 /100 | #152 | Good 6.5% |
| Immigrants | Eritrea | 77.4 /100 | #153 | Good 6.5% |
| Immigrants | Central America | 76.8 /100 | #154 | Good 6.5% |
| Inupiat | 76.7 /100 | #155 | Good 6.5% |
| Immigrants | Panama | 75.3 /100 | #156 | Good 6.5% |