Paraguayan vs Immigrants from Turkey Ambulatory Disability
COMPARE
Paraguayan
Immigrants from Turkey
Ambulatory Disability
Ambulatory Disability Comparison
Paraguayans
Immigrants from Turkey
5.5%
AMBULATORY DISABILITY
99.9/ 100
METRIC RATING
43rd/ 347
METRIC RANK
5.4%
AMBULATORY DISABILITY
100.0/ 100
METRIC RATING
30th/ 347
METRIC RANK
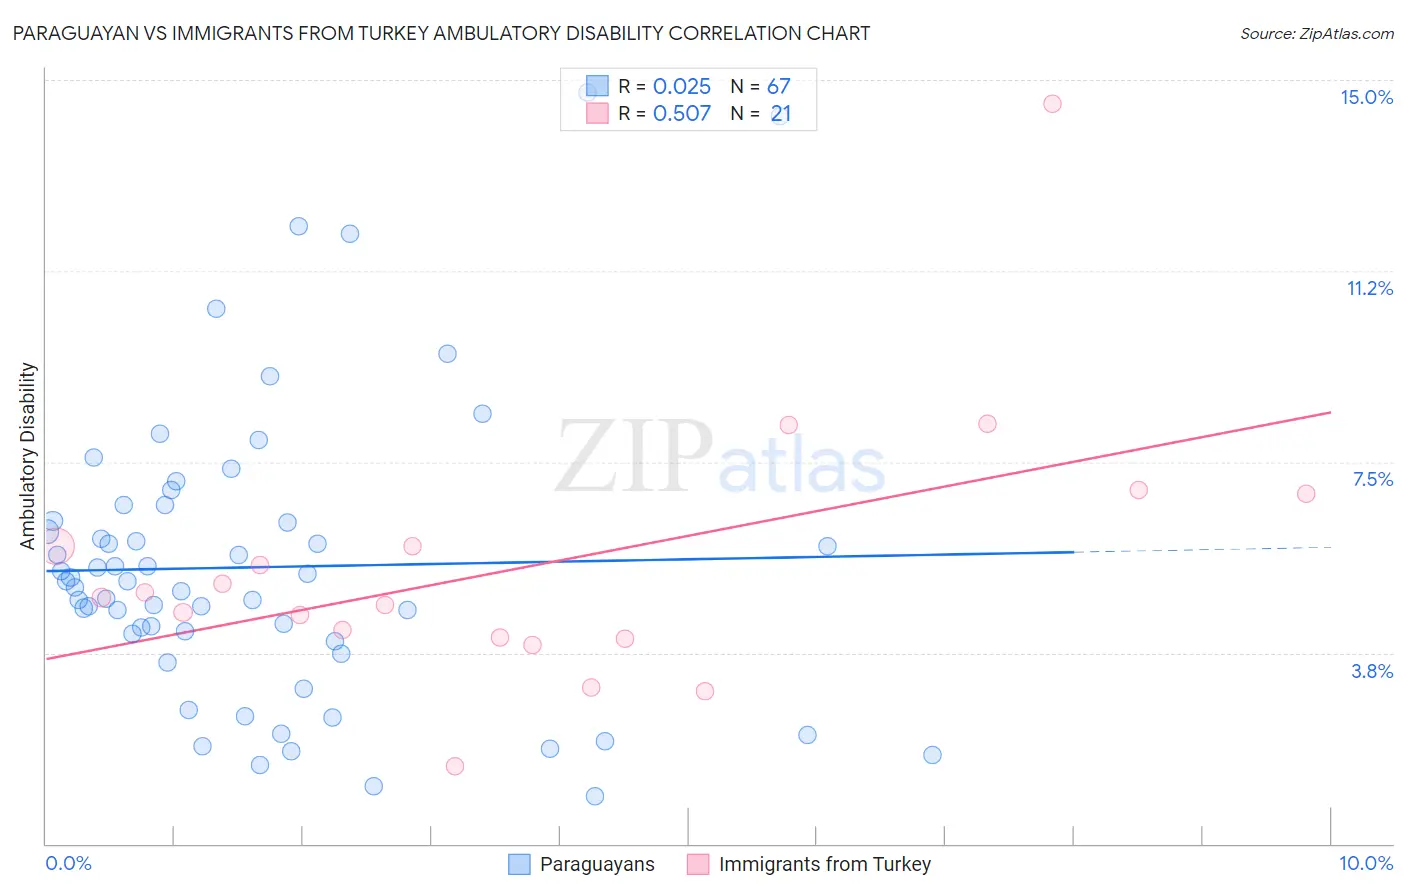
Paraguayan vs Immigrants from Turkey Ambulatory Disability Correlation Chart
The statistical analysis conducted on geographies consisting of 95,109,897 people shows no correlation between the proportion of Paraguayans and percentage of population with ambulatory disability in the United States with a correlation coefficient (R) of 0.025 and weighted average of 5.5%. Similarly, the statistical analysis conducted on geographies consisting of 223,019,564 people shows a substantial positive correlation between the proportion of Immigrants from Turkey and percentage of population with ambulatory disability in the United States with a correlation coefficient (R) of 0.507 and weighted average of 5.4%, a difference of 1.7%.
Ambulatory Disability Correlation Summary
| Measurement | Paraguayan | Immigrants from Turkey |
| Minimum | 0.94% | 1.5% |
| Maximum | 14.7% | 14.5% |
| Range | 13.8% | 13.0% |
| Mean | 5.4% | 5.4% |
| Median | 5.2% | 4.8% |
| Interquartile 25% (IQ1) | 4.0% | 4.0% |
| Interquartile 75% (IQ3) | 6.3% | 6.4% |
| Interquartile Range (IQR) | 2.4% | 2.3% |
| Standard Deviation (Sample) | 2.9% | 2.7% |
| Standard Deviation (Population) | 2.8% | 2.6% |
Demographics Similar to Paraguayans and Immigrants from Turkey by Ambulatory Disability
In terms of ambulatory disability, the demographic groups most similar to Paraguayans are Immigrants from Indonesia (5.5%, a difference of 0.12%), Immigrants from Sweden (5.6%, a difference of 0.28%), Egyptian (5.6%, a difference of 0.29%), Argentinean (5.5%, a difference of 0.54%), and Mongolian (5.5%, a difference of 0.61%). Similarly, the demographic groups most similar to Immigrants from Turkey are Immigrants from Venezuela (5.4%, a difference of 0.020%), Immigrants from Australia (5.5%, a difference of 0.19%), Immigrants from Pakistan (5.5%, a difference of 0.31%), Immigrants from Asia (5.5%, a difference of 0.47%), and Afghan (5.5%, a difference of 0.51%).
| Demographics | Rating | Rank | Ambulatory Disability |
| Immigrants | Nepal | 100.0 /100 | #26 | Exceptional 5.4% |
| Asians | 100.0 /100 | #27 | Exceptional 5.4% |
| Cambodians | 100.0 /100 | #28 | Exceptional 5.4% |
| Immigrants | Iran | 100.0 /100 | #29 | Exceptional 5.4% |
| Immigrants | Turkey | 100.0 /100 | #30 | Exceptional 5.4% |
| Immigrants | Venezuela | 100.0 /100 | #31 | Exceptional 5.4% |
| Immigrants | Australia | 100.0 /100 | #32 | Exceptional 5.5% |
| Immigrants | Pakistan | 100.0 /100 | #33 | Exceptional 5.5% |
| Immigrants | Asia | 100.0 /100 | #34 | Exceptional 5.5% |
| Afghans | 100.0 /100 | #35 | Exceptional 5.5% |
| Immigrants | Malaysia | 100.0 /100 | #36 | Exceptional 5.5% |
| Turks | 100.0 /100 | #37 | Exceptional 5.5% |
| Cypriots | 100.0 /100 | #38 | Exceptional 5.5% |
| Immigrants | Eritrea | 100.0 /100 | #39 | Exceptional 5.5% |
| Venezuelans | 99.9 /100 | #40 | Exceptional 5.5% |
| Mongolians | 99.9 /100 | #41 | Exceptional 5.5% |
| Argentineans | 99.9 /100 | #42 | Exceptional 5.5% |
| Paraguayans | 99.9 /100 | #43 | Exceptional 5.5% |
| Immigrants | Indonesia | 99.9 /100 | #44 | Exceptional 5.5% |
| Immigrants | Sweden | 99.9 /100 | #45 | Exceptional 5.6% |
| Egyptians | 99.9 /100 | #46 | Exceptional 5.6% |