Immigrants from Kenya vs Immigrants from Turkey Ambulatory Disability
COMPARE
Immigrants from Kenya
Immigrants from Turkey
Ambulatory Disability
Ambulatory Disability Comparison
Immigrants from Kenya
Immigrants from Turkey
5.8%
AMBULATORY DISABILITY
97.8/ 100
METRIC RATING
102nd/ 347
METRIC RANK
5.4%
AMBULATORY DISABILITY
100.0/ 100
METRIC RATING
30th/ 347
METRIC RANK
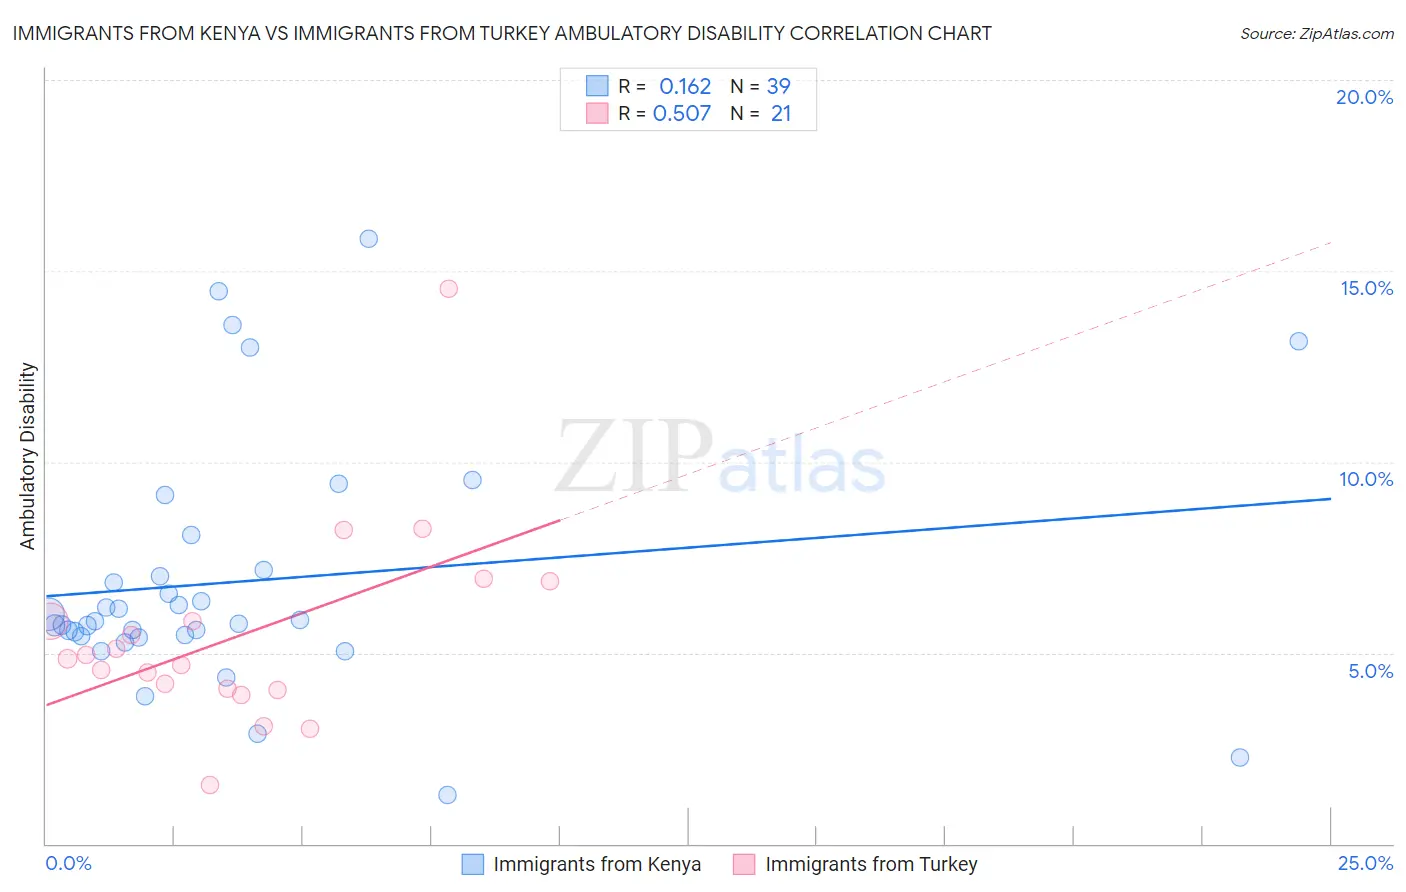
Immigrants from Kenya vs Immigrants from Turkey Ambulatory Disability Correlation Chart
The statistical analysis conducted on geographies consisting of 218,037,313 people shows a poor positive correlation between the proportion of Immigrants from Kenya and percentage of population with ambulatory disability in the United States with a correlation coefficient (R) of 0.162 and weighted average of 5.8%. Similarly, the statistical analysis conducted on geographies consisting of 223,019,564 people shows a substantial positive correlation between the proportion of Immigrants from Turkey and percentage of population with ambulatory disability in the United States with a correlation coefficient (R) of 0.507 and weighted average of 5.4%, a difference of 6.7%.
Ambulatory Disability Correlation Summary
| Measurement | Immigrants from Kenya | Immigrants from Turkey |
| Minimum | 1.3% | 1.5% |
| Maximum | 15.8% | 14.5% |
| Range | 14.6% | 13.0% |
| Mean | 6.9% | 5.4% |
| Median | 5.8% | 4.8% |
| Interquartile 25% (IQ1) | 5.4% | 4.0% |
| Interquartile 75% (IQ3) | 7.2% | 6.4% |
| Interquartile Range (IQR) | 1.7% | 2.3% |
| Standard Deviation (Sample) | 3.2% | 2.7% |
| Standard Deviation (Population) | 3.2% | 2.6% |
Similar Demographics by Ambulatory Disability
Demographics Similar to Immigrants from Kenya by Ambulatory Disability
In terms of ambulatory disability, the demographic groups most similar to Immigrants from Kenya are Immigrants from Romania (5.8%, a difference of 0.070%), Immigrants from Serbia (5.8%, a difference of 0.080%), Immigrants from South America (5.8%, a difference of 0.080%), New Zealander (5.8%, a difference of 0.13%), and Immigrants from Czechoslovakia (5.8%, a difference of 0.24%).
| Demographics | Rating | Rank | Ambulatory Disability |
| Immigrants | El Salvador | 98.4 /100 | #95 | Exceptional 5.8% |
| Salvadorans | 98.4 /100 | #96 | Exceptional 5.8% |
| Immigrants | Somalia | 98.3 /100 | #97 | Exceptional 5.8% |
| Immigrants | Lebanon | 98.3 /100 | #98 | Exceptional 5.8% |
| Immigrants | Northern Europe | 98.2 /100 | #99 | Exceptional 5.8% |
| Immigrants | Serbia | 97.9 /100 | #100 | Exceptional 5.8% |
| Immigrants | South America | 97.9 /100 | #101 | Exceptional 5.8% |
| Immigrants | Kenya | 97.8 /100 | #102 | Exceptional 5.8% |
| Immigrants | Romania | 97.7 /100 | #103 | Exceptional 5.8% |
| New Zealanders | 97.6 /100 | #104 | Exceptional 5.8% |
| Immigrants | Czechoslovakia | 97.4 /100 | #105 | Exceptional 5.8% |
| Immigrants | Morocco | 97.3 /100 | #106 | Exceptional 5.8% |
| Uruguayans | 97.2 /100 | #107 | Exceptional 5.8% |
| Colombians | 97.2 /100 | #108 | Exceptional 5.8% |
| Immigrants | Netherlands | 97.1 /100 | #109 | Exceptional 5.8% |
Demographics Similar to Immigrants from Turkey by Ambulatory Disability
In terms of ambulatory disability, the demographic groups most similar to Immigrants from Turkey are Immigrants from Venezuela (5.4%, a difference of 0.020%), Immigrants from Australia (5.5%, a difference of 0.19%), Immigrants from Pakistan (5.5%, a difference of 0.31%), Immigrants from Asia (5.5%, a difference of 0.47%), and Afghan (5.5%, a difference of 0.51%).
| Demographics | Rating | Rank | Ambulatory Disability |
| Tongans | 100.0 /100 | #23 | Exceptional 5.4% |
| Immigrants | Saudi Arabia | 100.0 /100 | #24 | Exceptional 5.4% |
| Zimbabweans | 100.0 /100 | #25 | Exceptional 5.4% |
| Immigrants | Nepal | 100.0 /100 | #26 | Exceptional 5.4% |
| Asians | 100.0 /100 | #27 | Exceptional 5.4% |
| Cambodians | 100.0 /100 | #28 | Exceptional 5.4% |
| Immigrants | Iran | 100.0 /100 | #29 | Exceptional 5.4% |
| Immigrants | Turkey | 100.0 /100 | #30 | Exceptional 5.4% |
| Immigrants | Venezuela | 100.0 /100 | #31 | Exceptional 5.4% |
| Immigrants | Australia | 100.0 /100 | #32 | Exceptional 5.5% |
| Immigrants | Pakistan | 100.0 /100 | #33 | Exceptional 5.5% |
| Immigrants | Asia | 100.0 /100 | #34 | Exceptional 5.5% |
| Afghans | 100.0 /100 | #35 | Exceptional 5.5% |
| Immigrants | Malaysia | 100.0 /100 | #36 | Exceptional 5.5% |
| Turks | 100.0 /100 | #37 | Exceptional 5.5% |