Panamanian vs English Ambulatory Disability
COMPARE
Panamanian
English
Ambulatory Disability
Ambulatory Disability Comparison
Panamanians
English
6.4%
AMBULATORY DISABILITY
3.1/ 100
METRIC RATING
231st/ 347
METRIC RANK
6.6%
AMBULATORY DISABILITY
0.4/ 100
METRIC RATING
262nd/ 347
METRIC RANK
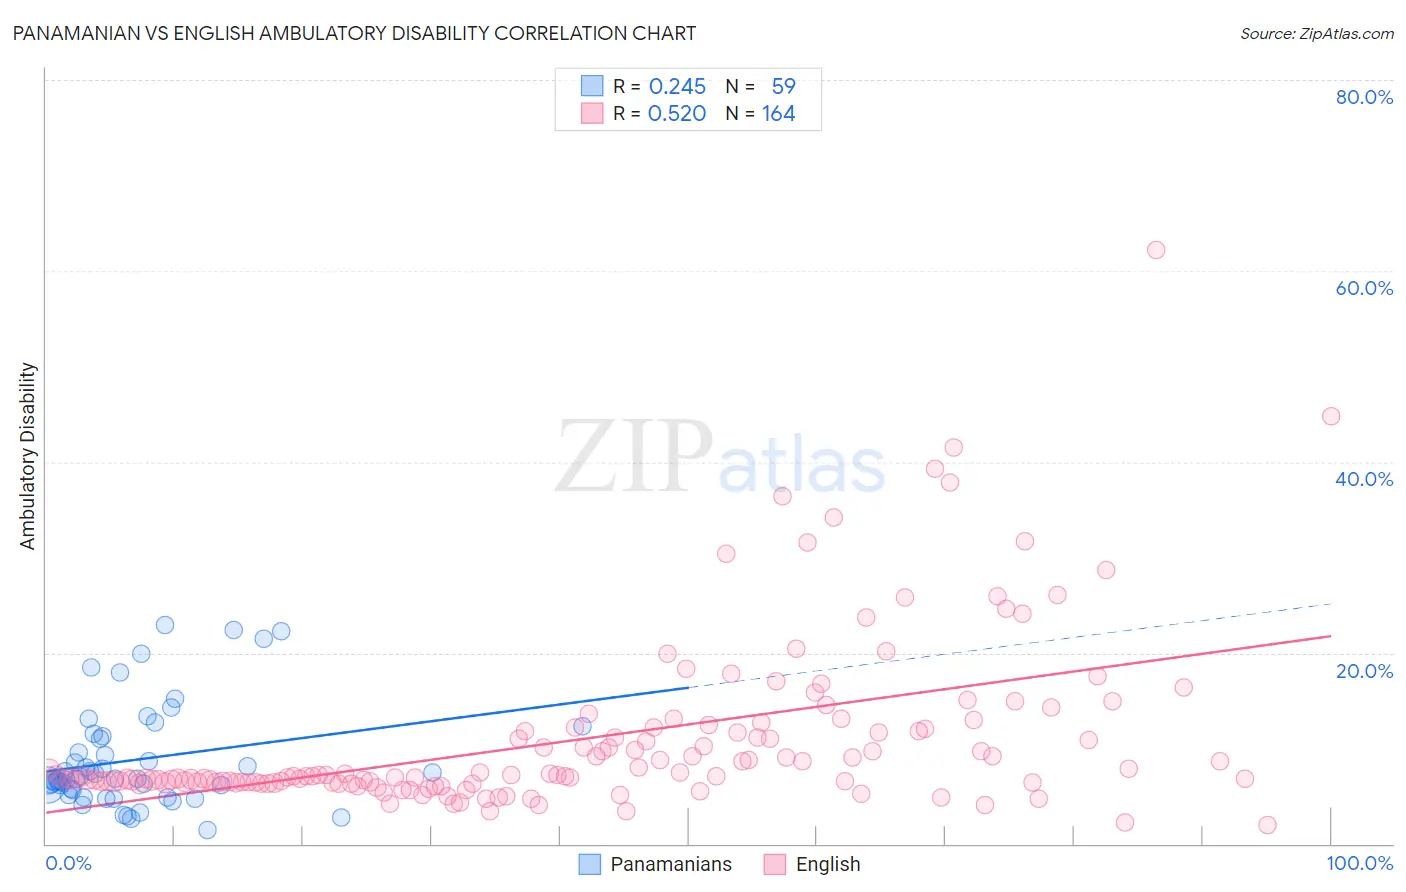
Panamanian vs English Ambulatory Disability Correlation Chart
The statistical analysis conducted on geographies consisting of 281,171,683 people shows a weak positive correlation between the proportion of Panamanians and percentage of population with ambulatory disability in the United States with a correlation coefficient (R) of 0.245 and weighted average of 6.4%. Similarly, the statistical analysis conducted on geographies consisting of 579,179,335 people shows a substantial positive correlation between the proportion of English and percentage of population with ambulatory disability in the United States with a correlation coefficient (R) of 0.520 and weighted average of 6.6%, a difference of 2.8%.
Ambulatory Disability Correlation Summary
| Measurement | Panamanian | English |
| Minimum | 1.5% | 2.0% |
| Maximum | 23.0% | 62.2% |
| Range | 21.5% | 60.2% |
| Mean | 8.8% | 11.0% |
| Median | 6.8% | 7.1% |
| Interquartile 25% (IQ1) | 5.6% | 6.4% |
| Interquartile 75% (IQ3) | 11.3% | 11.9% |
| Interquartile Range (IQR) | 5.7% | 5.5% |
| Standard Deviation (Sample) | 5.3% | 9.0% |
| Standard Deviation (Population) | 5.3% | 8.9% |
Similar Demographics by Ambulatory Disability
Demographics Similar to Panamanians by Ambulatory Disability
In terms of ambulatory disability, the demographic groups most similar to Panamanians are Mexican (6.4%, a difference of 0.16%), Czechoslovakian (6.4%, a difference of 0.26%), Portuguese (6.4%, a difference of 0.31%), Cuban (6.4%, a difference of 0.32%), and Assyrian/Chaldean/Syriac (6.4%, a difference of 0.33%).
| Demographics | Rating | Rank | Ambulatory Disability |
| Liberians | 7.1 /100 | #224 | Tragic 6.3% |
| Hondurans | 6.3 /100 | #225 | Tragic 6.3% |
| Slavs | 5.1 /100 | #226 | Tragic 6.4% |
| Cubans | 4.0 /100 | #227 | Tragic 6.4% |
| Portuguese | 4.0 /100 | #228 | Tragic 6.4% |
| Czechoslovakians | 3.8 /100 | #229 | Tragic 6.4% |
| Mexicans | 3.5 /100 | #230 | Tragic 6.4% |
| Panamanians | 3.1 /100 | #231 | Tragic 6.4% |
| Assyrians/Chaldeans/Syriacs | 2.4 /100 | #232 | Tragic 6.4% |
| Sub-Saharan Africans | 2.3 /100 | #233 | Tragic 6.4% |
| Immigrants | Liberia | 2.3 /100 | #234 | Tragic 6.4% |
| Hispanics or Latinos | 2.2 /100 | #235 | Tragic 6.4% |
| Dutch | 2.0 /100 | #236 | Tragic 6.4% |
| Immigrants | Germany | 1.8 /100 | #237 | Tragic 6.4% |
| Haitians | 1.8 /100 | #238 | Tragic 6.4% |
Demographics Similar to English by Ambulatory Disability
In terms of ambulatory disability, the demographic groups most similar to English are Hmong (6.6%, a difference of 0.12%), Irish (6.6%, a difference of 0.17%), Immigrants from Belize (6.6%, a difference of 0.24%), Aleut (6.6%, a difference of 0.25%), and Spanish American Indian (6.5%, a difference of 0.43%).
| Demographics | Rating | Rank | Ambulatory Disability |
| Welsh | 0.6 /100 | #255 | Tragic 6.5% |
| Immigrants | Uzbekistan | 0.6 /100 | #256 | Tragic 6.5% |
| Bermudans | 0.5 /100 | #257 | Tragic 6.5% |
| Spanish American Indians | 0.5 /100 | #258 | Tragic 6.5% |
| Aleuts | 0.4 /100 | #259 | Tragic 6.6% |
| Immigrants | Belize | 0.4 /100 | #260 | Tragic 6.6% |
| Irish | 0.4 /100 | #261 | Tragic 6.6% |
| English | 0.4 /100 | #262 | Tragic 6.6% |
| Hmong | 0.3 /100 | #263 | Tragic 6.6% |
| Nepalese | 0.2 /100 | #264 | Tragic 6.6% |
| Bahamians | 0.2 /100 | #265 | Tragic 6.6% |
| Guyanese | 0.2 /100 | #266 | Tragic 6.6% |
| Trinidadians and Tobagonians | 0.2 /100 | #267 | Tragic 6.6% |
| Spanish | 0.2 /100 | #268 | Tragic 6.6% |
| French | 0.1 /100 | #269 | Tragic 6.6% |