Hispanic or Latino vs Puerto Rican Vision Disability
COMPARE
Hispanic or Latino
Puerto Rican
Vision Disability
Vision Disability Comparison
Hispanics or Latinos
Puerto Ricans
2.6%
VISION DISABILITY
0.0/ 100
METRIC RATING
305th/ 347
METRIC RANK
3.9%
VISION DISABILITY
0.0/ 100
METRIC RATING
347th/ 347
METRIC RANK
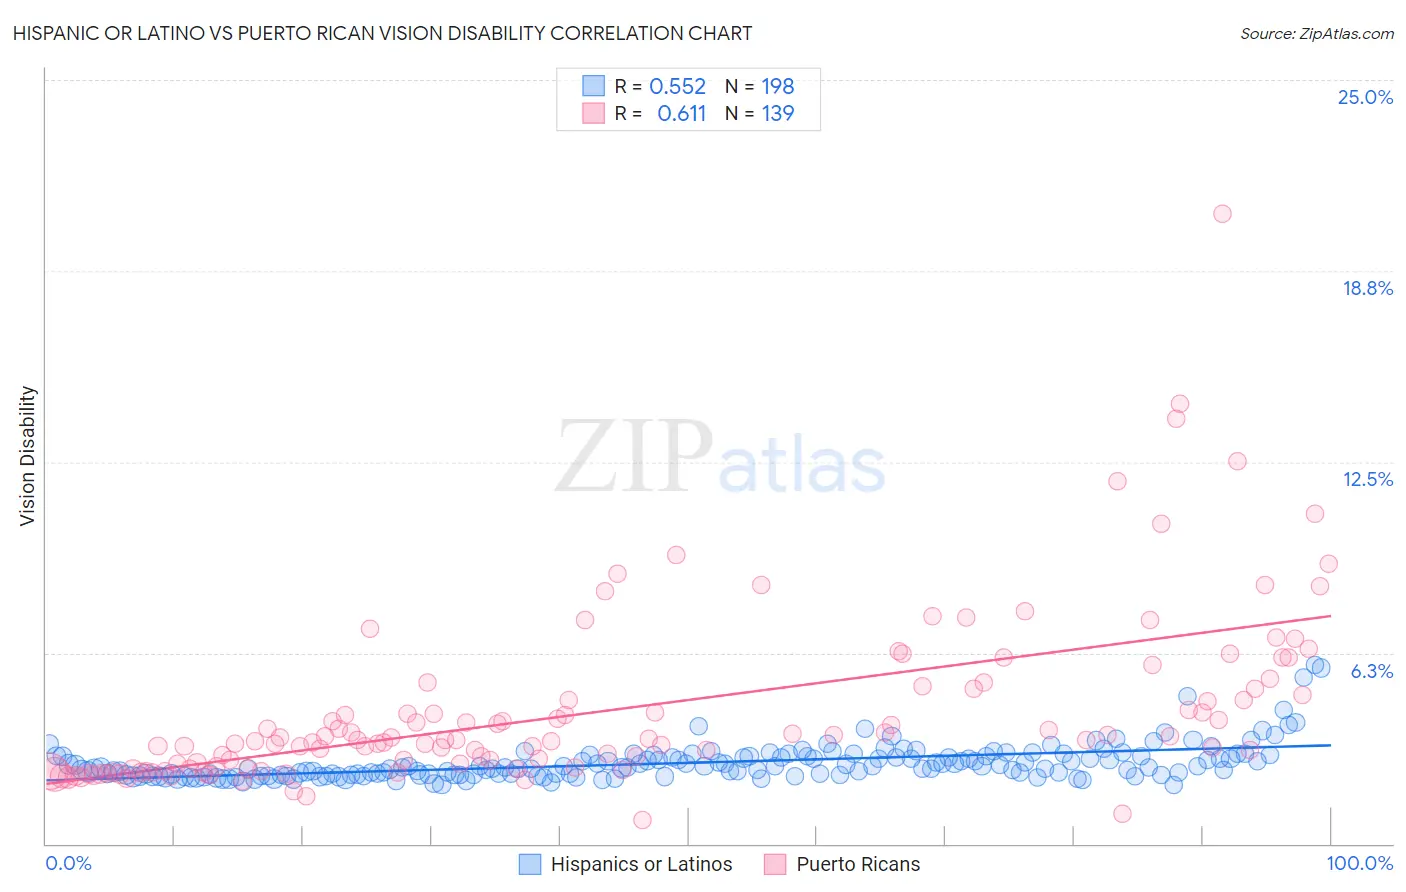
Hispanic or Latino vs Puerto Rican Vision Disability Correlation Chart
The statistical analysis conducted on geographies consisting of 574,500,029 people shows a substantial positive correlation between the proportion of Hispanics or Latinos and percentage of population with vision disability in the United States with a correlation coefficient (R) of 0.552 and weighted average of 2.6%. Similarly, the statistical analysis conducted on geographies consisting of 527,298,658 people shows a significant positive correlation between the proportion of Puerto Ricans and percentage of population with vision disability in the United States with a correlation coefficient (R) of 0.611 and weighted average of 3.9%, a difference of 49.6%.
Vision Disability Correlation Summary
| Measurement | Hispanic or Latino | Puerto Rican |
| Minimum | 1.9% | 0.78% |
| Maximum | 5.8% | 20.6% |
| Range | 3.9% | 19.8% |
| Mean | 2.6% | 4.4% |
| Median | 2.5% | 3.4% |
| Interquartile 25% (IQ1) | 2.3% | 2.5% |
| Interquartile 75% (IQ3) | 2.9% | 5.1% |
| Interquartile Range (IQR) | 0.59% | 2.6% |
| Standard Deviation (Sample) | 0.59% | 2.9% |
| Standard Deviation (Population) | 0.59% | 2.9% |
Similar Demographics by Vision Disability
Demographics Similar to Hispanics or Latinos by Vision Disability
In terms of vision disability, the demographic groups most similar to Hispanics or Latinos are Aleut (2.6%, a difference of 0.30%), Immigrants from Cabo Verde (2.6%, a difference of 0.43%), Iroquois (2.6%, a difference of 0.61%), Immigrants from Dominican Republic (2.6%, a difference of 0.64%), and Arapaho (2.6%, a difference of 0.65%).
| Demographics | Rating | Rank | Vision Disability |
| Mexicans | 0.0 /100 | #298 | Tragic 2.5% |
| Cree | 0.0 /100 | #299 | Tragic 2.5% |
| Africans | 0.0 /100 | #300 | Tragic 2.5% |
| Menominee | 0.0 /100 | #301 | Tragic 2.5% |
| Spanish American Indians | 0.0 /100 | #302 | Tragic 2.6% |
| Immigrants | Cabo Verde | 0.0 /100 | #303 | Tragic 2.6% |
| Aleuts | 0.0 /100 | #304 | Tragic 2.6% |
| Hispanics or Latinos | 0.0 /100 | #305 | Tragic 2.6% |
| Iroquois | 0.0 /100 | #306 | Tragic 2.6% |
| Immigrants | Dominican Republic | 0.0 /100 | #307 | Tragic 2.6% |
| Arapaho | 0.0 /100 | #308 | Tragic 2.6% |
| Immigrants | Yemen | 0.0 /100 | #309 | Tragic 2.6% |
| Blackfeet | 0.0 /100 | #310 | Tragic 2.6% |
| Dominicans | 0.0 /100 | #311 | Tragic 2.6% |
| Americans | 0.0 /100 | #312 | Tragic 2.6% |
Demographics Similar to Puerto Ricans by Vision Disability
In terms of vision disability, the demographic groups most similar to Puerto Ricans are Houma (3.4%, a difference of 12.7%), Lumbee (3.4%, a difference of 14.5%), Pueblo (3.3%, a difference of 16.4%), Pima (3.3%, a difference of 16.4%), and Choctaw (3.3%, a difference of 17.6%).
| Demographics | Rating | Rank | Vision Disability |
| Cajuns | 0.0 /100 | #333 | Tragic 3.1% |
| Cheyenne | 0.0 /100 | #334 | Tragic 3.1% |
| Navajo | 0.0 /100 | #335 | Tragic 3.1% |
| Alaskan Athabascans | 0.0 /100 | #336 | Tragic 3.1% |
| Dutch West Indians | 0.0 /100 | #337 | Tragic 3.2% |
| Chickasaw | 0.0 /100 | #338 | Tragic 3.2% |
| Tsimshian | 0.0 /100 | #339 | Tragic 3.2% |
| Creek | 0.0 /100 | #340 | Tragic 3.2% |
| Kiowa | 0.0 /100 | #341 | Tragic 3.3% |
| Choctaw | 0.0 /100 | #342 | Tragic 3.3% |
| Pima | 0.0 /100 | #343 | Tragic 3.3% |
| Pueblo | 0.0 /100 | #344 | Tragic 3.3% |
| Lumbee | 0.0 /100 | #345 | Tragic 3.4% |
| Houma | 0.0 /100 | #346 | Tragic 3.4% |
| Puerto Ricans | 0.0 /100 | #347 | Tragic 3.9% |