Vietnamese vs Immigrants from Moldova Disability Age 35 to 64
COMPARE
Vietnamese
Immigrants from Moldova
Disability Age 35 to 64
Disability Age 35 to 64 Comparison
Vietnamese
Immigrants from Moldova
10.6%
DISABILITY AGE 35 TO 64
95.4/ 100
METRIC RATING
120th/ 347
METRIC RANK
10.6%
DISABILITY AGE 35 TO 64
95.5/ 100
METRIC RATING
118th/ 347
METRIC RANK
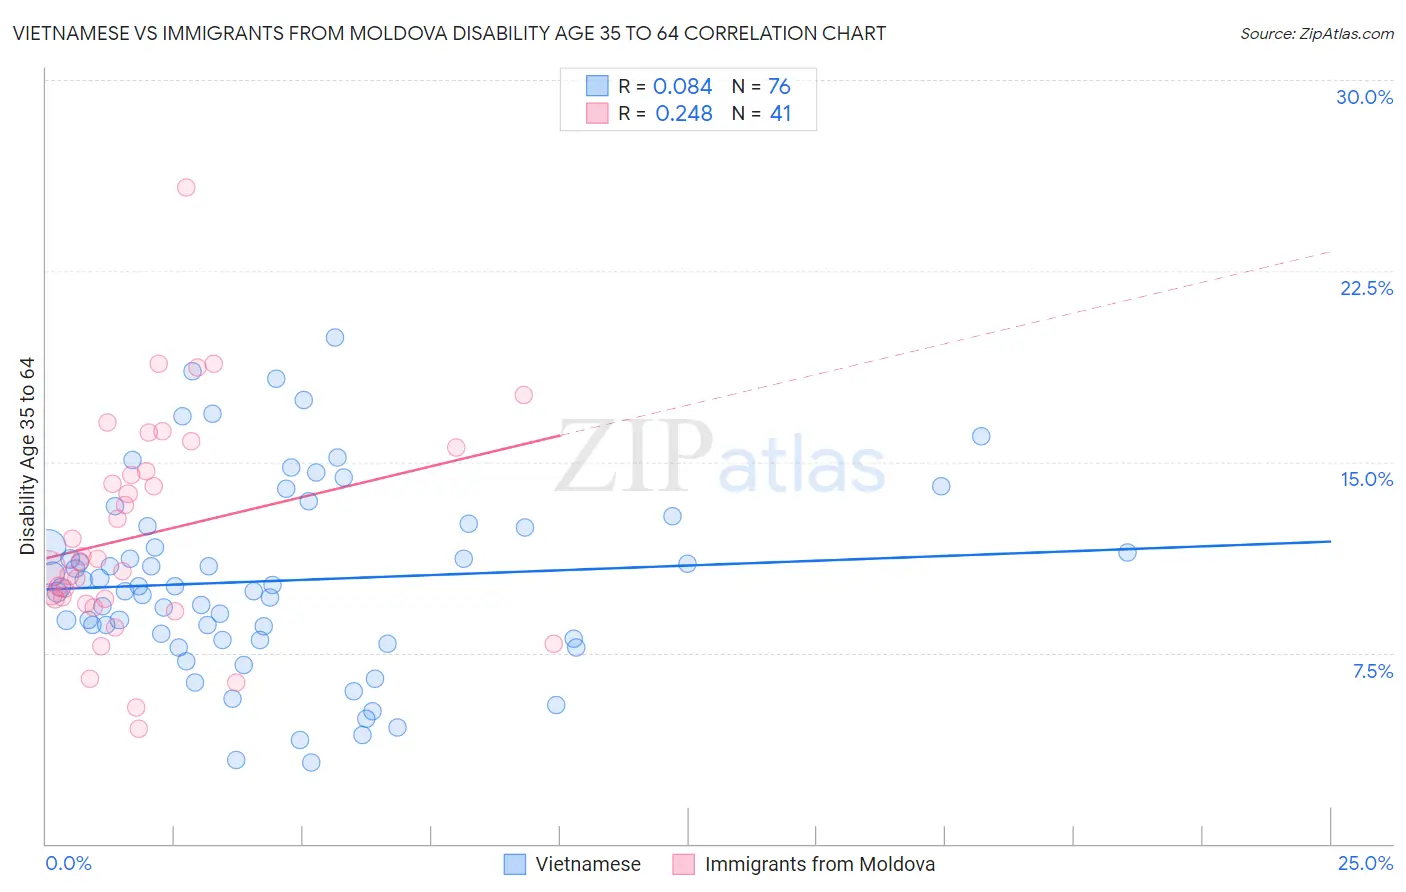
Vietnamese vs Immigrants from Moldova Disability Age 35 to 64 Correlation Chart
The statistical analysis conducted on geographies consisting of 170,653,846 people shows a slight positive correlation between the proportion of Vietnamese and percentage of population with a disability between the ages 34 and 64 in the United States with a correlation coefficient (R) of 0.084 and weighted average of 10.6%. Similarly, the statistical analysis conducted on geographies consisting of 124,364,571 people shows a weak positive correlation between the proportion of Immigrants from Moldova and percentage of population with a disability between the ages 34 and 64 in the United States with a correlation coefficient (R) of 0.248 and weighted average of 10.6%, a difference of 0.070%.
Disability Age 35 to 64 Correlation Summary
| Measurement | Vietnamese | Immigrants from Moldova |
| Minimum | 3.2% | 4.5% |
| Maximum | 19.9% | 25.8% |
| Range | 16.7% | 21.2% |
| Mean | 10.3% | 12.2% |
| Median | 10.1% | 11.1% |
| Interquartile 25% (IQ1) | 8.0% | 9.5% |
| Interquartile 75% (IQ3) | 12.5% | 15.1% |
| Interquartile Range (IQR) | 4.4% | 5.6% |
| Standard Deviation (Sample) | 3.7% | 4.3% |
| Standard Deviation (Population) | 3.6% | 4.3% |
Demographics Similar to Vietnamese and Immigrants from Moldova by Disability Age 35 to 64
In terms of disability age 35 to 64, the demographic groups most similar to Vietnamese are Luxembourger (10.6%, a difference of 0.020%), Immigrants from South Eastern Asia (10.6%, a difference of 0.16%), Romanian (10.6%, a difference of 0.17%), Immigrants from Norway (10.6%, a difference of 0.20%), and Immigrants from Nepal (10.6%, a difference of 0.26%). Similarly, the demographic groups most similar to Immigrants from Moldova are Luxembourger (10.6%, a difference of 0.050%), Immigrants from South Eastern Asia (10.6%, a difference of 0.090%), Immigrants from Nepal (10.6%, a difference of 0.19%), Romanian (10.6%, a difference of 0.24%), and Immigrants from Norway (10.6%, a difference of 0.27%).
| Demographics | Rating | Rank | Disability Age 35 to 64 |
| Immigrants | Ethiopia | 97.2 /100 | #109 | Exceptional 10.5% |
| Koreans | 97.1 /100 | #110 | Exceptional 10.5% |
| Brazilians | 96.9 /100 | #111 | Exceptional 10.5% |
| Assyrians/Chaldeans/Syriacs | 96.8 /100 | #112 | Exceptional 10.5% |
| Tongans | 96.6 /100 | #113 | Exceptional 10.5% |
| Immigrants | Morocco | 96.6 /100 | #114 | Exceptional 10.5% |
| Immigrants | Netherlands | 96.3 /100 | #115 | Exceptional 10.5% |
| Immigrants | Nepal | 95.9 /100 | #116 | Exceptional 10.6% |
| Immigrants | South Eastern Asia | 95.7 /100 | #117 | Exceptional 10.6% |
| Immigrants | Moldova | 95.5 /100 | #118 | Exceptional 10.6% |
| Luxembourgers | 95.5 /100 | #119 | Exceptional 10.6% |
| Vietnamese | 95.4 /100 | #120 | Exceptional 10.6% |
| Romanians | 95.0 /100 | #121 | Exceptional 10.6% |
| Immigrants | Norway | 95.0 /100 | #122 | Exceptional 10.6% |
| Maltese | 94.8 /100 | #123 | Exceptional 10.6% |
| Estonians | 94.5 /100 | #124 | Exceptional 10.6% |
| Albanians | 94.2 /100 | #125 | Exceptional 10.6% |
| Immigrants | Afghanistan | 94.1 /100 | #126 | Exceptional 10.6% |
| Immigrants | Zimbabwe | 94.0 /100 | #127 | Exceptional 10.6% |
| South Africans | 93.3 /100 | #128 | Exceptional 10.7% |
| Ecuadorians | 93.1 /100 | #129 | Exceptional 10.7% |