Nicaraguan vs Navajo Ambulatory Disability
COMPARE
Nicaraguan
Navajo
Ambulatory Disability
Ambulatory Disability Comparison
Nicaraguans
Navajo
6.1%
AMBULATORY DISABILITY
63.2/ 100
METRIC RATING
165th/ 347
METRIC RANK
7.5%
AMBULATORY DISABILITY
0.0/ 100
METRIC RATING
324th/ 347
METRIC RANK
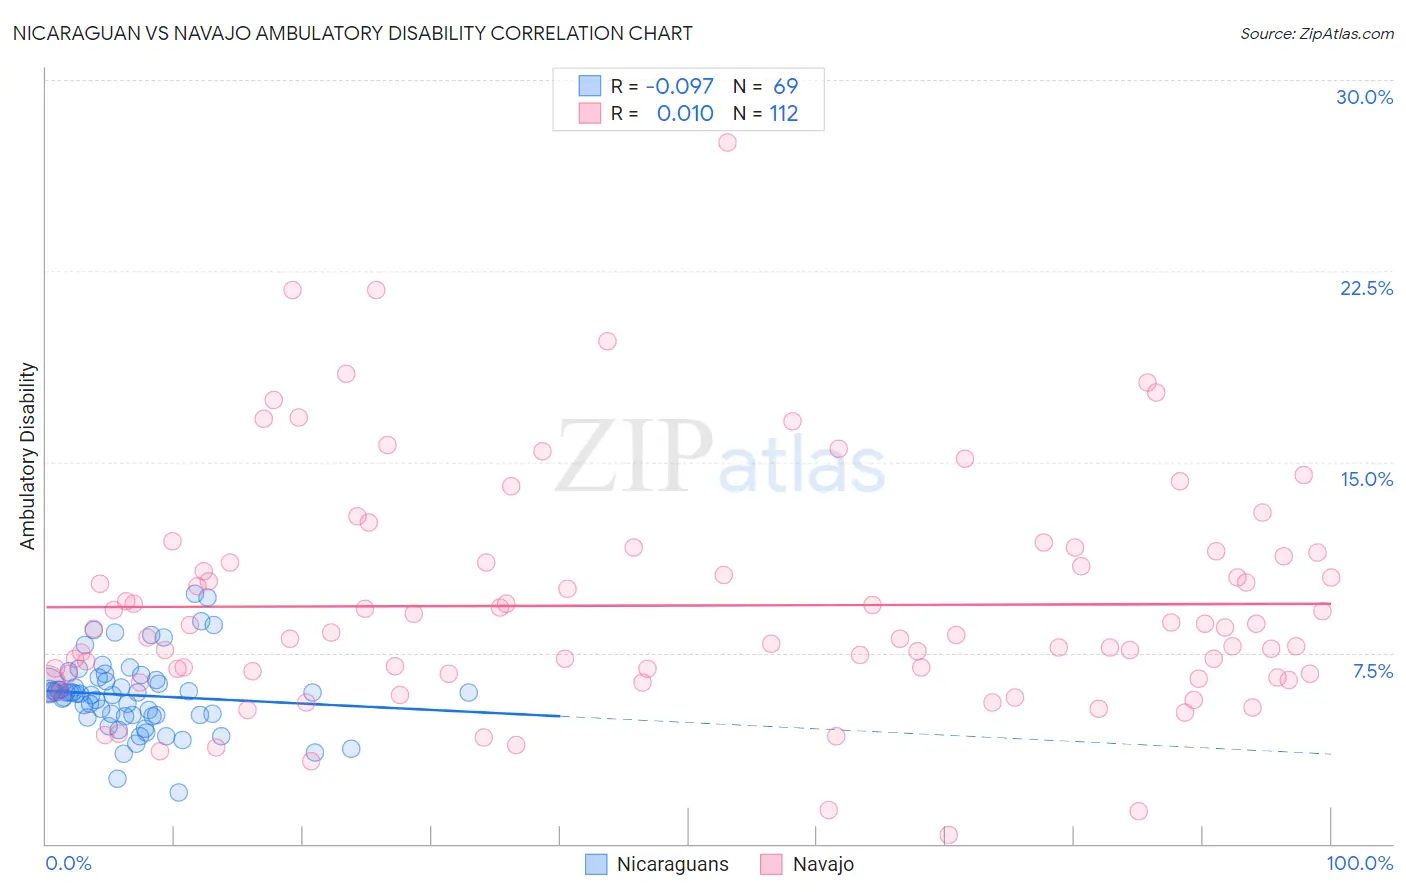
Nicaraguan vs Navajo Ambulatory Disability Correlation Chart
The statistical analysis conducted on geographies consisting of 285,681,314 people shows a slight negative correlation between the proportion of Nicaraguans and percentage of population with ambulatory disability in the United States with a correlation coefficient (R) of -0.097 and weighted average of 6.1%. Similarly, the statistical analysis conducted on geographies consisting of 224,747,889 people shows no correlation between the proportion of Navajo and percentage of population with ambulatory disability in the United States with a correlation coefficient (R) of 0.010 and weighted average of 7.5%, a difference of 23.6%.
Ambulatory Disability Correlation Summary
| Measurement | Nicaraguan | Navajo |
| Minimum | 2.0% | 0.36% |
| Maximum | 9.8% | 27.6% |
| Range | 7.8% | 27.2% |
| Mean | 5.8% | 9.4% |
| Median | 5.9% | 8.3% |
| Interquartile 25% (IQ1) | 5.0% | 6.7% |
| Interquartile 75% (IQ3) | 6.4% | 11.2% |
| Interquartile Range (IQR) | 1.4% | 4.5% |
| Standard Deviation (Sample) | 1.5% | 4.5% |
| Standard Deviation (Population) | 1.5% | 4.5% |
Similar Demographics by Ambulatory Disability
Demographics Similar to Nicaraguans by Ambulatory Disability
In terms of ambulatory disability, the demographic groups most similar to Nicaraguans are Iraqi (6.1%, a difference of 0.020%), Basque (6.1%, a difference of 0.030%), Immigrants from Oceania (6.1%, a difference of 0.14%), Ecuadorian (6.1%, a difference of 0.15%), and Lebanese (6.1%, a difference of 0.18%).
| Demographics | Rating | Rank | Ambulatory Disability |
| Immigrants | Fiji | 71.2 /100 | #158 | Good 6.0% |
| Immigrants | Latvia | 71.1 /100 | #159 | Good 6.0% |
| Central Americans | 69.8 /100 | #160 | Good 6.0% |
| Immigrants | Belarus | 69.2 /100 | #161 | Good 6.1% |
| Nigerians | 67.1 /100 | #162 | Good 6.1% |
| Lebanese | 66.2 /100 | #163 | Good 6.1% |
| Basques | 63.7 /100 | #164 | Good 6.1% |
| Nicaraguans | 63.2 /100 | #165 | Good 6.1% |
| Iraqis | 62.8 /100 | #166 | Good 6.1% |
| Immigrants | Oceania | 60.7 /100 | #167 | Good 6.1% |
| Ecuadorians | 60.5 /100 | #168 | Good 6.1% |
| Immigrants | Southern Europe | 58.1 /100 | #169 | Average 6.1% |
| Immigrants | Ecuador | 53.8 /100 | #170 | Average 6.1% |
| Moroccans | 52.6 /100 | #171 | Average 6.1% |
| Immigrants | Burma/Myanmar | 52.2 /100 | #172 | Average 6.1% |
Demographics Similar to Navajo by Ambulatory Disability
In terms of ambulatory disability, the demographic groups most similar to Navajo are Comanche (7.5%, a difference of 0.070%), Black/African American (7.5%, a difference of 0.18%), Native/Alaskan (7.5%, a difference of 0.20%), Hopi (7.6%, a difference of 1.1%), and Pueblo (7.6%, a difference of 1.2%).
| Demographics | Rating | Rank | Ambulatory Disability |
| Central American Indians | 0.0 /100 | #317 | Tragic 7.2% |
| Ottawa | 0.0 /100 | #318 | Tragic 7.2% |
| Dominicans | 0.0 /100 | #319 | Tragic 7.2% |
| Potawatomi | 0.0 /100 | #320 | Tragic 7.3% |
| Apache | 0.0 /100 | #321 | Tragic 7.4% |
| Osage | 0.0 /100 | #322 | Tragic 7.4% |
| Americans | 0.0 /100 | #323 | Tragic 7.4% |
| Navajo | 0.0 /100 | #324 | Tragic 7.5% |
| Comanche | 0.0 /100 | #325 | Tragic 7.5% |
| Blacks/African Americans | 0.0 /100 | #326 | Tragic 7.5% |
| Natives/Alaskans | 0.0 /100 | #327 | Tragic 7.5% |
| Hopi | 0.0 /100 | #328 | Tragic 7.6% |
| Pueblo | 0.0 /100 | #329 | Tragic 7.6% |
| Paiute | 0.0 /100 | #330 | Tragic 7.7% |
| Cajuns | 0.0 /100 | #331 | Tragic 7.8% |