Immigrants from France vs Immigrants from Burma/Myanmar Cognitive Disability
COMPARE
Immigrants from France
Immigrants from Burma/Myanmar
Cognitive Disability
Cognitive Disability Comparison
Immigrants from France
Immigrants from Burma/Myanmar
17.4%
COGNITIVE DISABILITY
29.8/ 100
METRIC RATING
188th/ 347
METRIC RANK
18.2%
COGNITIVE DISABILITY
0.0/ 100
METRIC RATING
296th/ 347
METRIC RANK
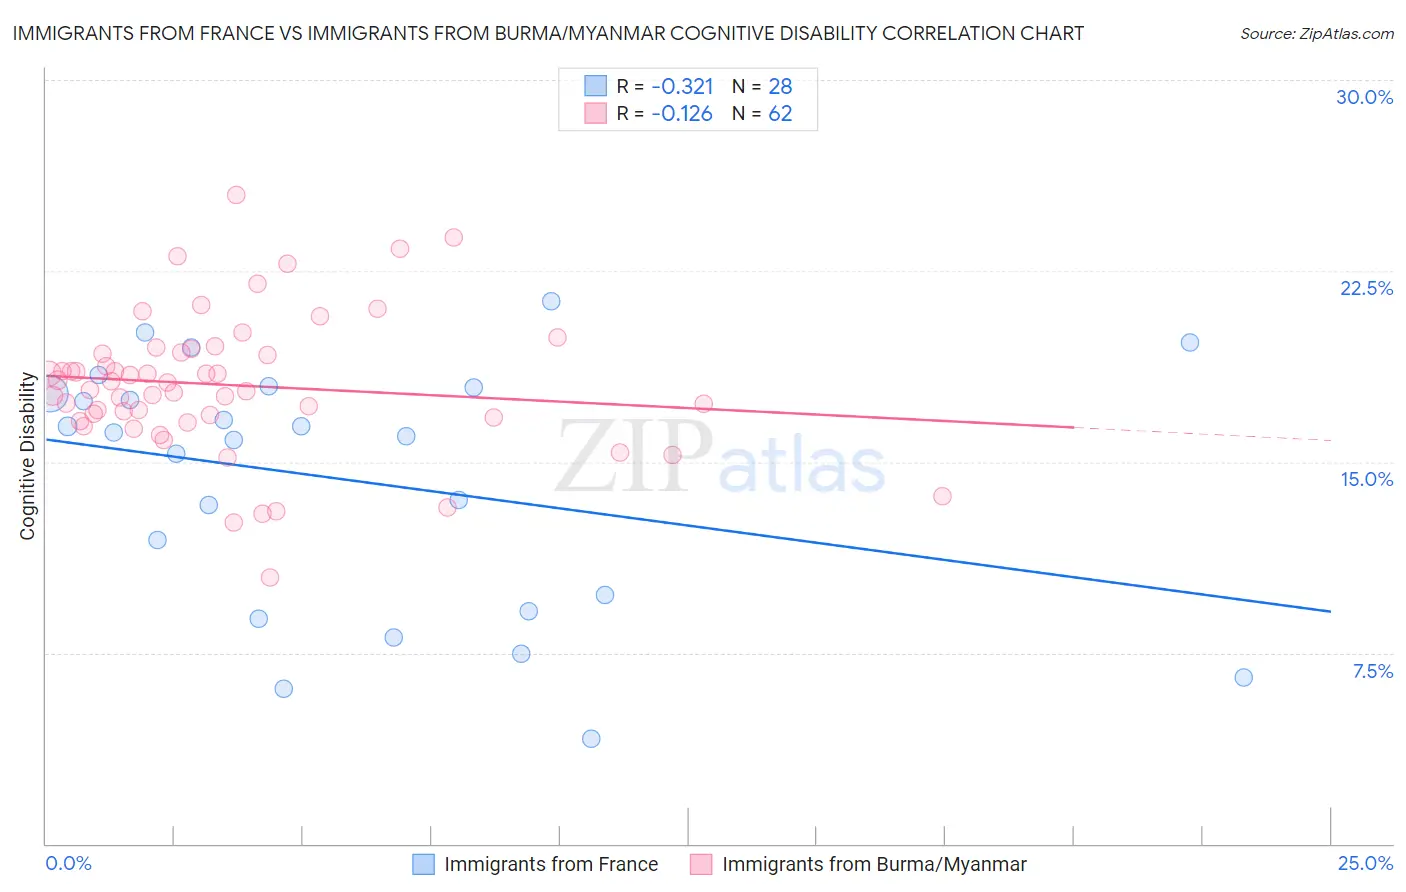
Immigrants from France vs Immigrants from Burma/Myanmar Cognitive Disability Correlation Chart
The statistical analysis conducted on geographies consisting of 287,908,122 people shows a mild negative correlation between the proportion of Immigrants from France and percentage of population with cognitive disability in the United States with a correlation coefficient (R) of -0.321 and weighted average of 17.4%. Similarly, the statistical analysis conducted on geographies consisting of 172,345,235 people shows a poor negative correlation between the proportion of Immigrants from Burma/Myanmar and percentage of population with cognitive disability in the United States with a correlation coefficient (R) of -0.126 and weighted average of 18.2%, a difference of 4.9%.
Cognitive Disability Correlation Summary
| Measurement | Immigrants from France | Immigrants from Burma/Myanmar |
| Minimum | 4.1% | 10.5% |
| Maximum | 21.3% | 25.5% |
| Range | 17.2% | 15.0% |
| Mean | 14.3% | 18.0% |
| Median | 16.1% | 18.0% |
| Interquartile 25% (IQ1) | 9.5% | 16.7% |
| Interquartile 75% (IQ3) | 17.8% | 19.3% |
| Interquartile Range (IQR) | 8.3% | 2.6% |
| Standard Deviation (Sample) | 4.9% | 2.8% |
| Standard Deviation (Population) | 4.8% | 2.7% |
Similar Demographics by Cognitive Disability
Demographics Similar to Immigrants from France by Cognitive Disability
In terms of cognitive disability, the demographic groups most similar to Immigrants from France are Immigrants from Western Asia (17.4%, a difference of 0.010%), Immigrants from Spain (17.4%, a difference of 0.070%), Nonimmigrants (17.4%, a difference of 0.080%), Immigrants from Haiti (17.4%, a difference of 0.090%), and Immigrants from Fiji (17.4%, a difference of 0.13%).
| Demographics | Rating | Rank | Cognitive Disability |
| Immigrants | Guyana | 42.9 /100 | #181 | Average 17.3% |
| Arabs | 42.8 /100 | #182 | Average 17.3% |
| Spaniards | 40.3 /100 | #183 | Average 17.3% |
| Crow | 39.1 /100 | #184 | Fair 17.3% |
| Afghans | 38.2 /100 | #185 | Fair 17.3% |
| Cambodians | 35.9 /100 | #186 | Fair 17.3% |
| Immigrants | Fiji | 33.7 /100 | #187 | Fair 17.4% |
| Immigrants | France | 29.8 /100 | #188 | Fair 17.4% |
| Immigrants | Western Asia | 29.5 /100 | #189 | Fair 17.4% |
| Immigrants | Spain | 27.7 /100 | #190 | Fair 17.4% |
| Immigrants | Nonimmigrants | 27.4 /100 | #191 | Fair 17.4% |
| Immigrants | Haiti | 27.1 /100 | #192 | Fair 17.4% |
| Delaware | 25.6 /100 | #193 | Fair 17.4% |
| Immigrants | Bosnia and Herzegovina | 22.0 /100 | #194 | Fair 17.4% |
| New Zealanders | 21.1 /100 | #195 | Fair 17.4% |
Demographics Similar to Immigrants from Burma/Myanmar by Cognitive Disability
In terms of cognitive disability, the demographic groups most similar to Immigrants from Burma/Myanmar are German Russian (18.2%, a difference of 0.020%), Blackfeet (18.3%, a difference of 0.14%), Japanese (18.3%, a difference of 0.14%), Ghanaian (18.3%, a difference of 0.18%), and British West Indian (18.2%, a difference of 0.20%).
| Demographics | Rating | Rank | Cognitive Disability |
| Natives/Alaskans | 0.1 /100 | #289 | Tragic 18.1% |
| Immigrants | Africa | 0.1 /100 | #290 | Tragic 18.1% |
| Ottawa | 0.1 /100 | #291 | Tragic 18.2% |
| Iroquois | 0.1 /100 | #292 | Tragic 18.2% |
| Central American Indians | 0.1 /100 | #293 | Tragic 18.2% |
| British West Indians | 0.1 /100 | #294 | Tragic 18.2% |
| German Russians | 0.0 /100 | #295 | Tragic 18.2% |
| Immigrants | Burma/Myanmar | 0.0 /100 | #296 | Tragic 18.2% |
| Blackfeet | 0.0 /100 | #297 | Tragic 18.3% |
| Japanese | 0.0 /100 | #298 | Tragic 18.3% |
| Ghanaians | 0.0 /100 | #299 | Tragic 18.3% |
| Creek | 0.0 /100 | #300 | Tragic 18.3% |
| Immigrants | Ghana | 0.0 /100 | #301 | Tragic 18.3% |
| Barbadians | 0.0 /100 | #302 | Tragic 18.3% |
| Immigrants | Kenya | 0.0 /100 | #303 | Tragic 18.3% |