Northern European vs Immigrants from Zaire 7th Grade
COMPARE
Northern European
Immigrants from Zaire
7th Grade
7th Grade Comparison
Northern Europeans
Immigrants from Zaire
97.1%
7TH GRADE
99.9/ 100
METRIC RATING
44th/ 347
METRIC RANK
95.9%
7TH GRADE
26.7/ 100
METRIC RATING
197th/ 347
METRIC RANK
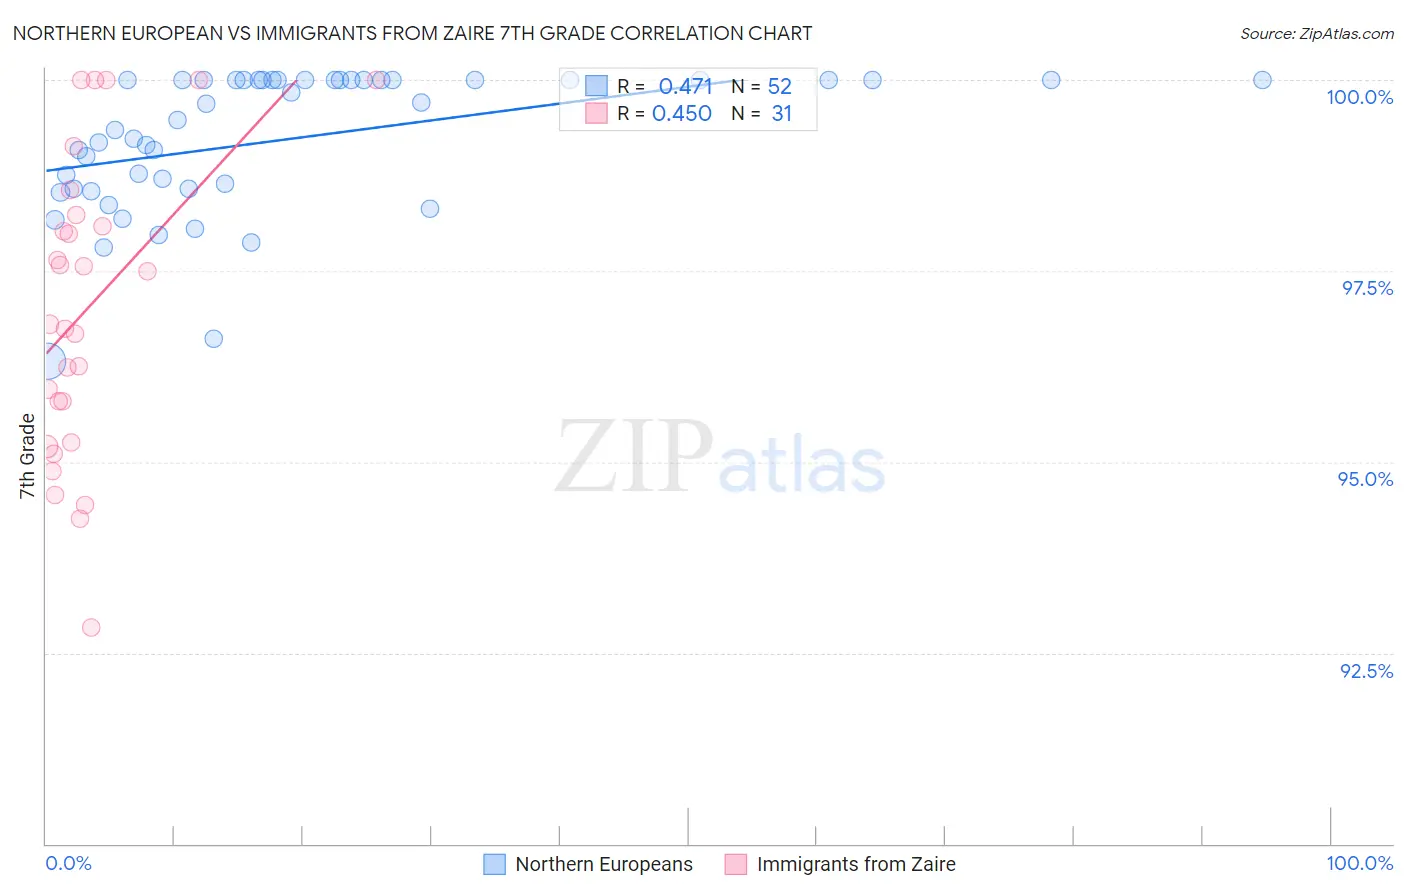
Northern European vs Immigrants from Zaire 7th Grade Correlation Chart
The statistical analysis conducted on geographies consisting of 406,093,361 people shows a moderate positive correlation between the proportion of Northern Europeans and percentage of population with at least 7th grade education in the United States with a correlation coefficient (R) of 0.471 and weighted average of 97.1%. Similarly, the statistical analysis conducted on geographies consisting of 107,212,695 people shows a moderate positive correlation between the proportion of Immigrants from Zaire and percentage of population with at least 7th grade education in the United States with a correlation coefficient (R) of 0.450 and weighted average of 95.9%, a difference of 1.3%.
7th Grade Correlation Summary
| Measurement | Northern European | Immigrants from Zaire |
| Minimum | 96.3% | 92.8% |
| Maximum | 100.0% | 100.0% |
| Range | 3.7% | 7.2% |
| Mean | 99.2% | 97.0% |
| Median | 99.6% | 96.8% |
| Interquartile 25% (IQ1) | 98.6% | 95.2% |
| Interquartile 75% (IQ3) | 100.0% | 98.2% |
| Interquartile Range (IQR) | 1.4% | 3.0% |
| Standard Deviation (Sample) | 0.92% | 2.0% |
| Standard Deviation (Population) | 0.91% | 1.9% |
Similar Demographics by 7th Grade
Demographics Similar to Northern Europeans by 7th Grade
In terms of 7th grade, the demographic groups most similar to Northern Europeans are Maltese (97.1%, a difference of 0.0%), Czechoslovakian (97.1%, a difference of 0.010%), Aleut (97.1%, a difference of 0.010%), Bulgarian (97.1%, a difference of 0.030%), and Chinese (97.1%, a difference of 0.040%).
| Demographics | Rating | Rank | 7th Grade |
| British | 100.0 /100 | #37 | Exceptional 97.2% |
| Belgians | 100.0 /100 | #38 | Exceptional 97.2% |
| Latvians | 100.0 /100 | #39 | Exceptional 97.2% |
| Luxembourgers | 100.0 /100 | #40 | Exceptional 97.2% |
| Eastern Europeans | 100.0 /100 | #41 | Exceptional 97.2% |
| Chinese | 99.9 /100 | #42 | Exceptional 97.1% |
| Maltese | 99.9 /100 | #43 | Exceptional 97.1% |
| Northern Europeans | 99.9 /100 | #44 | Exceptional 97.1% |
| Czechoslovakians | 99.9 /100 | #45 | Exceptional 97.1% |
| Aleuts | 99.9 /100 | #46 | Exceptional 97.1% |
| Bulgarians | 99.9 /100 | #47 | Exceptional 97.1% |
| Celtics | 99.9 /100 | #48 | Exceptional 97.1% |
| Slavs | 99.9 /100 | #49 | Exceptional 97.1% |
| Immigrants | Scotland | 99.9 /100 | #50 | Exceptional 97.1% |
| Estonians | 99.9 /100 | #51 | Exceptional 97.0% |
Demographics Similar to Immigrants from Zaire by 7th Grade
In terms of 7th grade, the demographic groups most similar to Immigrants from Zaire are Sudanese (95.9%, a difference of 0.010%), Apache (95.9%, a difference of 0.010%), Immigrants from Nepal (95.9%, a difference of 0.020%), Paraguayan (95.9%, a difference of 0.020%), and Immigrants from Bahamas (95.9%, a difference of 0.030%).
| Demographics | Rating | Rank | 7th Grade |
| Immigrants | Micronesia | 32.6 /100 | #190 | Fair 95.9% |
| Liberians | 32.5 /100 | #191 | Fair 95.9% |
| Panamanians | 32.3 /100 | #192 | Fair 95.9% |
| Immigrants | Bahamas | 30.8 /100 | #193 | Fair 95.9% |
| Immigrants | Nepal | 30.0 /100 | #194 | Fair 95.9% |
| Sudanese | 28.1 /100 | #195 | Fair 95.9% |
| Apache | 27.6 /100 | #196 | Fair 95.9% |
| Immigrants | Zaire | 26.7 /100 | #197 | Fair 95.9% |
| Paraguayans | 24.8 /100 | #198 | Fair 95.9% |
| Guamanians/Chamorros | 23.5 /100 | #199 | Fair 95.9% |
| Argentineans | 23.2 /100 | #200 | Fair 95.9% |
| Immigrants | Argentina | 21.9 /100 | #201 | Fair 95.9% |
| Immigrants | Northern Africa | 21.4 /100 | #202 | Fair 95.8% |
| Comanche | 21.1 /100 | #203 | Fair 95.8% |
| Assyrians/Chaldeans/Syriacs | 20.5 /100 | #204 | Fair 95.8% |