Guatemalan vs Immigrants from Belgium Disability Age 18 to 34
COMPARE
Guatemalan
Immigrants from Belgium
Disability Age 18 to 34
Disability Age 18 to 34 Comparison
Guatemalans
Immigrants from Belgium
6.4%
DISABILITY AGE 18 TO 34
89.6/ 100
METRIC RATING
132nd/ 347
METRIC RANK
6.4%
DISABILITY AGE 18 TO 34
83.5/ 100
METRIC RATING
148th/ 347
METRIC RANK
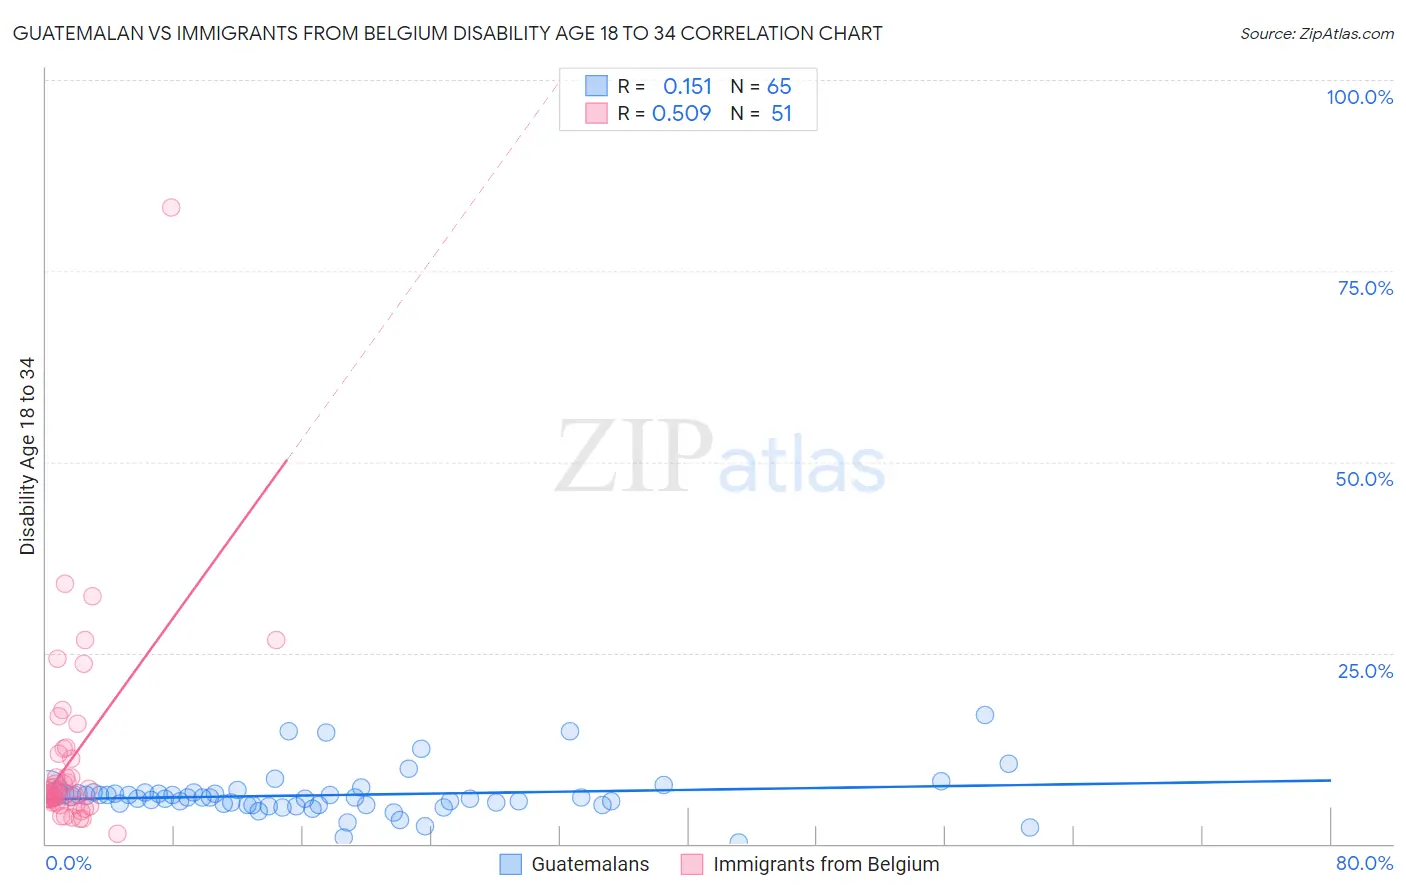
Guatemalan vs Immigrants from Belgium Disability Age 18 to 34 Correlation Chart
The statistical analysis conducted on geographies consisting of 408,778,912 people shows a poor positive correlation between the proportion of Guatemalans and percentage of population with a disability between the ages 18 and 35 in the United States with a correlation coefficient (R) of 0.151 and weighted average of 6.4%. Similarly, the statistical analysis conducted on geographies consisting of 146,565,744 people shows a substantial positive correlation between the proportion of Immigrants from Belgium and percentage of population with a disability between the ages 18 and 35 in the United States with a correlation coefficient (R) of 0.509 and weighted average of 6.4%, a difference of 0.95%.
Disability Age 18 to 34 Correlation Summary
| Measurement | Guatemalan | Immigrants from Belgium |
| Minimum | 0.22% | 1.3% |
| Maximum | 16.9% | 83.3% |
| Range | 16.7% | 82.1% |
| Mean | 6.4% | 11.1% |
| Median | 6.0% | 6.5% |
| Interquartile 25% (IQ1) | 5.1% | 5.4% |
| Interquartile 75% (IQ3) | 6.6% | 11.7% |
| Interquartile Range (IQR) | 1.6% | 6.3% |
| Standard Deviation (Sample) | 3.0% | 12.8% |
| Standard Deviation (Population) | 2.9% | 12.7% |
Demographics Similar to Guatemalans and Immigrants from Belgium by Disability Age 18 to 34
In terms of disability age 18 to 34, the demographic groups most similar to Guatemalans are Brazilian (6.4%, a difference of 0.12%), Immigrants from Europe (6.4%, a difference of 0.15%), Immigrants from Saudi Arabia (6.3%, a difference of 0.16%), Immigrants from Dominica (6.3%, a difference of 0.18%), and Palestinian (6.4%, a difference of 0.20%). Similarly, the demographic groups most similar to Immigrants from Belgium are Immigrants from South Africa (6.4%, a difference of 0.020%), Honduran (6.4%, a difference of 0.060%), Immigrants from Dominican Republic (6.4%, a difference of 0.10%), Belizean (6.4%, a difference of 0.18%), and Moroccan (6.4%, a difference of 0.23%).
| Demographics | Rating | Rank | Disability Age 18 to 34 |
| Immigrants | Dominica | 90.5 /100 | #130 | Exceptional 6.3% |
| Immigrants | Saudi Arabia | 90.4 /100 | #131 | Exceptional 6.3% |
| Guatemalans | 89.6 /100 | #132 | Excellent 6.4% |
| Brazilians | 89.0 /100 | #133 | Excellent 6.4% |
| Immigrants | Europe | 88.8 /100 | #134 | Excellent 6.4% |
| Palestinians | 88.5 /100 | #135 | Excellent 6.4% |
| Immigrants | Sweden | 88.5 /100 | #136 | Excellent 6.4% |
| Immigrants | Honduras | 87.7 /100 | #137 | Excellent 6.4% |
| Spanish American Indians | 87.7 /100 | #138 | Excellent 6.4% |
| Immigrants | Belize | 87.4 /100 | #139 | Excellent 6.4% |
| Immigrants | Fiji | 87.3 /100 | #140 | Excellent 6.4% |
| Jamaicans | 86.8 /100 | #141 | Excellent 6.4% |
| South American Indians | 86.5 /100 | #142 | Excellent 6.4% |
| Immigrants | Latvia | 86.4 /100 | #143 | Excellent 6.4% |
| Albanians | 85.3 /100 | #144 | Excellent 6.4% |
| Moroccans | 85.2 /100 | #145 | Excellent 6.4% |
| Belizeans | 84.9 /100 | #146 | Excellent 6.4% |
| Immigrants | South Africa | 83.7 /100 | #147 | Excellent 6.4% |
| Immigrants | Belgium | 83.5 /100 | #148 | Excellent 6.4% |
| Hondurans | 83.1 /100 | #149 | Excellent 6.4% |
| Immigrants | Dominican Republic | 82.7 /100 | #150 | Excellent 6.4% |