Nigerian vs Immigrants from Kenya Disability Age 65 to 74
COMPARE
Nigerian
Immigrants from Kenya
Disability Age 65 to 74
Disability Age 65 to 74 Comparison
Nigerians
Immigrants from Kenya
24.2%
DISABILITY AGE 65 TO 74
7.8/ 100
METRIC RATING
227th/ 347
METRIC RANK
23.8%
DISABILITY AGE 65 TO 74
19.6/ 100
METRIC RATING
209th/ 347
METRIC RANK
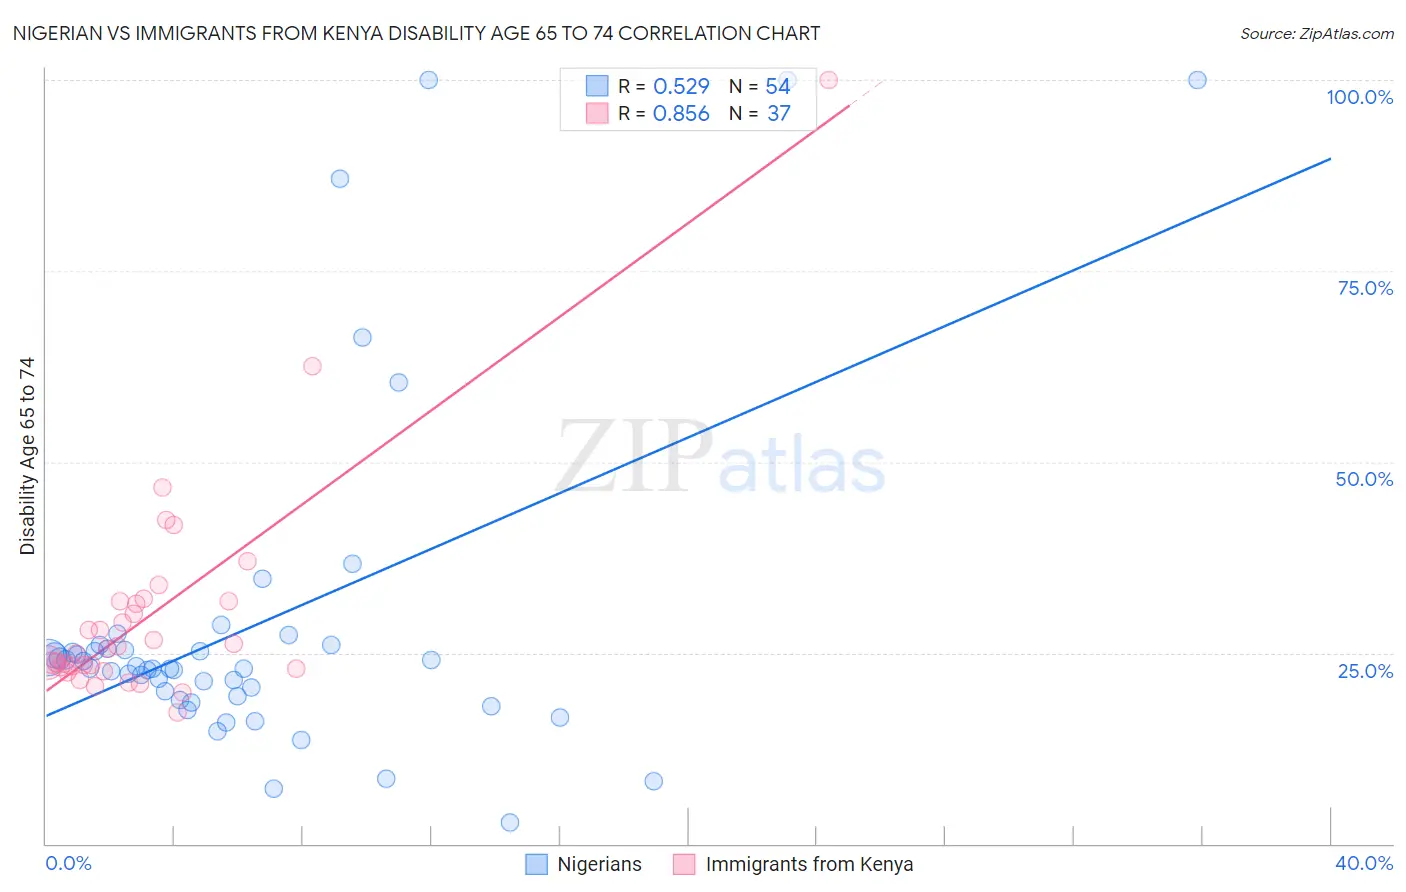
Nigerian vs Immigrants from Kenya Disability Age 65 to 74 Correlation Chart
The statistical analysis conducted on geographies consisting of 331,948,820 people shows a substantial positive correlation between the proportion of Nigerians and percentage of population with a disability between the ages 65 and 75 in the United States with a correlation coefficient (R) of 0.529 and weighted average of 24.2%. Similarly, the statistical analysis conducted on geographies consisting of 217,828,278 people shows a very strong positive correlation between the proportion of Immigrants from Kenya and percentage of population with a disability between the ages 65 and 75 in the United States with a correlation coefficient (R) of 0.856 and weighted average of 23.8%, a difference of 1.5%.
Disability Age 65 to 74 Correlation Summary
| Measurement | Nigerian | Immigrants from Kenya |
| Minimum | 2.8% | 17.1% |
| Maximum | 100.0% | 100.0% |
| Range | 97.2% | 82.9% |
| Mean | 28.6% | 30.1% |
| Median | 23.0% | 25.6% |
| Interquartile 25% (IQ1) | 19.3% | 23.0% |
| Interquartile 75% (IQ3) | 25.6% | 31.8% |
| Interquartile Range (IQR) | 6.4% | 8.8% |
| Standard Deviation (Sample) | 21.9% | 14.7% |
| Standard Deviation (Population) | 21.7% | 14.5% |
Demographics Similar to Nigerians and Immigrants from Kenya by Disability Age 65 to 74
In terms of disability age 65 to 74, the demographic groups most similar to Nigerians are Bermudan (24.2%, a difference of 0.070%), Iraqi (24.2%, a difference of 0.070%), Immigrants from Panama (24.1%, a difference of 0.16%), Immigrants from Middle Africa (24.1%, a difference of 0.21%), and White/Caucasian (24.2%, a difference of 0.25%). Similarly, the demographic groups most similar to Immigrants from Kenya are Immigrants from Barbados (23.8%, a difference of 0.0%), Trinidadian and Tobagonian (23.9%, a difference of 0.31%), Immigrants from West Indies (23.9%, a difference of 0.35%), French (23.9%, a difference of 0.38%), and Nicaraguan (23.9%, a difference of 0.54%).
| Demographics | Rating | Rank | Disability Age 65 to 74 |
| Immigrants | Barbados | 19.6 /100 | #208 | Poor 23.8% |
| Immigrants | Kenya | 19.6 /100 | #209 | Poor 23.8% |
| Trinidadians and Tobagonians | 16.4 /100 | #210 | Poor 23.9% |
| Immigrants | West Indies | 15.9 /100 | #211 | Poor 23.9% |
| French | 15.7 /100 | #212 | Poor 23.9% |
| Nicaraguans | 14.3 /100 | #213 | Poor 23.9% |
| Immigrants | Oceania | 13.6 /100 | #214 | Poor 24.0% |
| Pennsylvania Germans | 13.3 /100 | #215 | Poor 24.0% |
| Jamaicans | 12.2 /100 | #216 | Poor 24.0% |
| Immigrants | Portugal | 11.7 /100 | #217 | Poor 24.0% |
| Immigrants | Nigeria | 11.7 /100 | #218 | Poor 24.0% |
| Immigrants | Burma/Myanmar | 11.6 /100 | #219 | Poor 24.0% |
| Ghanaians | 10.4 /100 | #220 | Poor 24.1% |
| Immigrants | Nicaragua | 9.8 /100 | #221 | Tragic 24.1% |
| Native Hawaiians | 9.3 /100 | #222 | Tragic 24.1% |
| Immigrants | Middle Africa | 8.9 /100 | #223 | Tragic 24.1% |
| Immigrants | Panama | 8.6 /100 | #224 | Tragic 24.1% |
| Bermudans | 8.2 /100 | #225 | Tragic 24.2% |
| Iraqis | 8.1 /100 | #226 | Tragic 24.2% |
| Nigerians | 7.8 /100 | #227 | Tragic 24.2% |
| Whites/Caucasians | 6.6 /100 | #228 | Tragic 24.2% |