Nigerian vs Immigrants from Western Africa Disability Age 65 to 74
COMPARE
Nigerian
Immigrants from Western Africa
Disability Age 65 to 74
Disability Age 65 to 74 Comparison
Nigerians
Immigrants from Western Africa
24.2%
DISABILITY AGE 65 TO 74
7.8/ 100
METRIC RATING
227th/ 347
METRIC RANK
24.6%
DISABILITY AGE 65 TO 74
2.3/ 100
METRIC RATING
241st/ 347
METRIC RANK
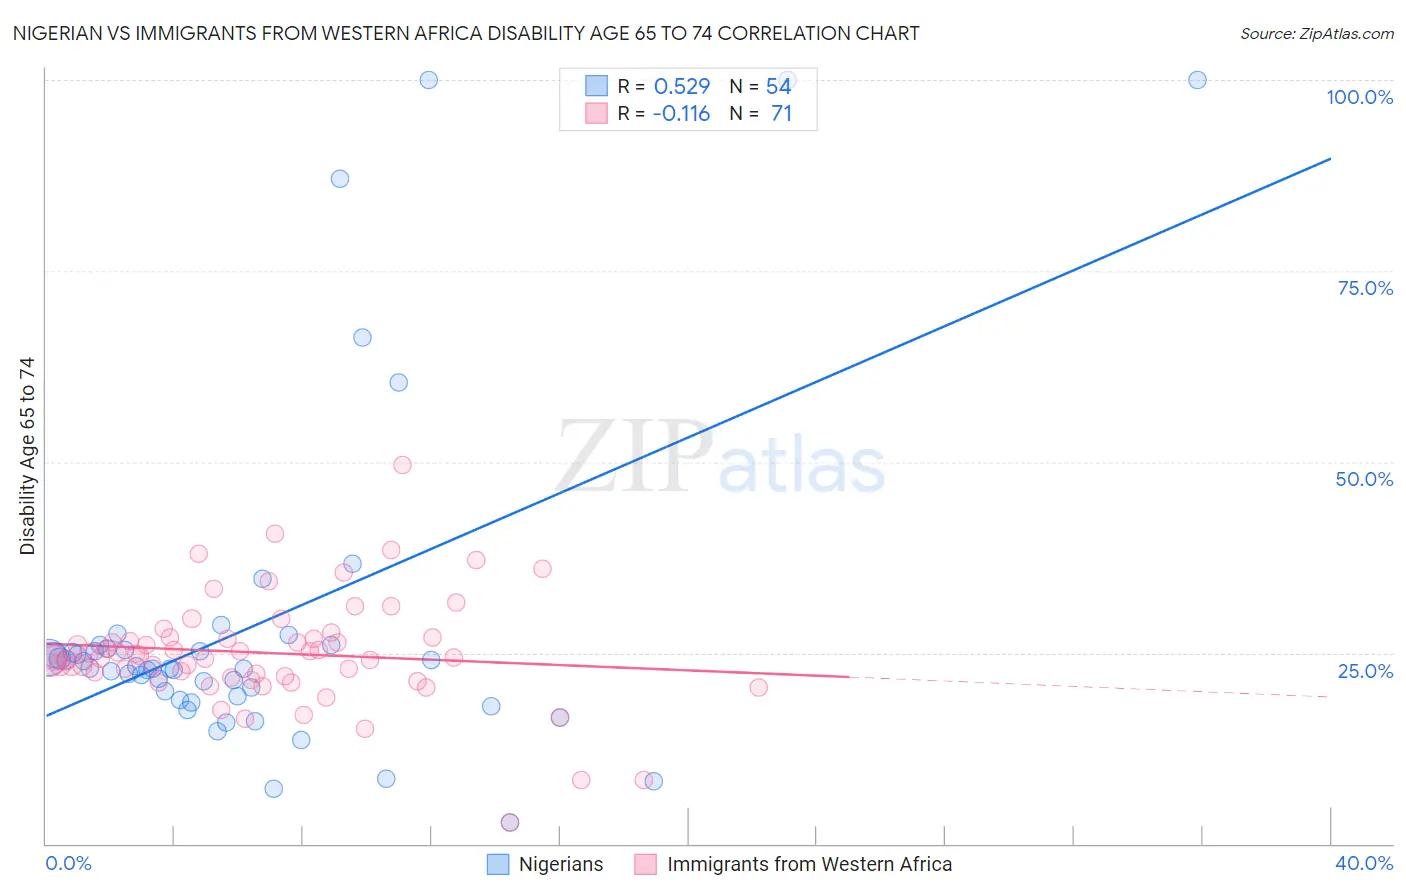
Nigerian vs Immigrants from Western Africa Disability Age 65 to 74 Correlation Chart
The statistical analysis conducted on geographies consisting of 331,948,820 people shows a substantial positive correlation between the proportion of Nigerians and percentage of population with a disability between the ages 65 and 75 in the United States with a correlation coefficient (R) of 0.529 and weighted average of 24.2%. Similarly, the statistical analysis conducted on geographies consisting of 356,971,422 people shows a poor negative correlation between the proportion of Immigrants from Western Africa and percentage of population with a disability between the ages 65 and 75 in the United States with a correlation coefficient (R) of -0.116 and weighted average of 24.6%, a difference of 1.8%.
Disability Age 65 to 74 Correlation Summary
| Measurement | Nigerian | Immigrants from Western Africa |
| Minimum | 2.8% | 2.8% |
| Maximum | 100.0% | 49.7% |
| Range | 97.2% | 46.8% |
| Mean | 28.6% | 25.0% |
| Median | 23.0% | 24.3% |
| Interquartile 25% (IQ1) | 19.3% | 21.8% |
| Interquartile 75% (IQ3) | 25.6% | 26.9% |
| Interquartile Range (IQR) | 6.4% | 5.1% |
| Standard Deviation (Sample) | 21.9% | 7.2% |
| Standard Deviation (Population) | 21.7% | 7.1% |
Demographics Similar to Nigerians and Immigrants from Western Africa by Disability Age 65 to 74
In terms of disability age 65 to 74, the demographic groups most similar to Nigerians are Bermudan (24.2%, a difference of 0.070%), Iraqi (24.2%, a difference of 0.070%), Immigrants from Panama (24.1%, a difference of 0.16%), White/Caucasian (24.2%, a difference of 0.25%), and Celtic (24.2%, a difference of 0.29%). Similarly, the demographic groups most similar to Immigrants from Western Africa are Spaniard (24.6%, a difference of 0.080%), Immigrants from Senegal (24.6%, a difference of 0.080%), Spanish (24.6%, a difference of 0.090%), Immigrants from Caribbean (24.6%, a difference of 0.17%), and Armenian (24.7%, a difference of 0.22%).
| Demographics | Rating | Rank | Disability Age 65 to 74 |
| Immigrants | Panama | 8.6 /100 | #224 | Tragic 24.1% |
| Bermudans | 8.2 /100 | #225 | Tragic 24.2% |
| Iraqis | 8.1 /100 | #226 | Tragic 24.2% |
| Nigerians | 7.8 /100 | #227 | Tragic 24.2% |
| Whites/Caucasians | 6.6 /100 | #228 | Tragic 24.2% |
| Celtics | 6.4 /100 | #229 | Tragic 24.2% |
| Barbadians | 6.0 /100 | #230 | Tragic 24.3% |
| Immigrants | Thailand | 5.2 /100 | #231 | Tragic 24.3% |
| Immigrants | Zaire | 5.0 /100 | #232 | Tragic 24.3% |
| Bahamians | 4.5 /100 | #233 | Tragic 24.4% |
| Panamanians | 4.2 /100 | #234 | Tragic 24.4% |
| Scotch-Irish | 3.8 /100 | #235 | Tragic 24.4% |
| German Russians | 3.7 /100 | #236 | Tragic 24.4% |
| West Indians | 3.4 /100 | #237 | Tragic 24.5% |
| Immigrants | Ghana | 3.0 /100 | #238 | Tragic 24.5% |
| Immigrants | Caribbean | 2.6 /100 | #239 | Tragic 24.6% |
| Spaniards | 2.4 /100 | #240 | Tragic 24.6% |
| Immigrants | Western Africa | 2.3 /100 | #241 | Tragic 24.6% |
| Immigrants | Senegal | 2.2 /100 | #242 | Tragic 24.6% |
| Spanish | 2.2 /100 | #243 | Tragic 24.6% |
| Armenians | 2.0 /100 | #244 | Tragic 24.7% |