Menominee vs Immigrants from Kenya Disability Age 65 to 74
COMPARE
Menominee
Immigrants from Kenya
Disability Age 65 to 74
Disability Age 65 to 74 Comparison
Menominee
Immigrants from Kenya
27.4%
DISABILITY AGE 65 TO 74
0.0/ 100
METRIC RATING
311th/ 347
METRIC RANK
23.8%
DISABILITY AGE 65 TO 74
19.6/ 100
METRIC RATING
209th/ 347
METRIC RANK
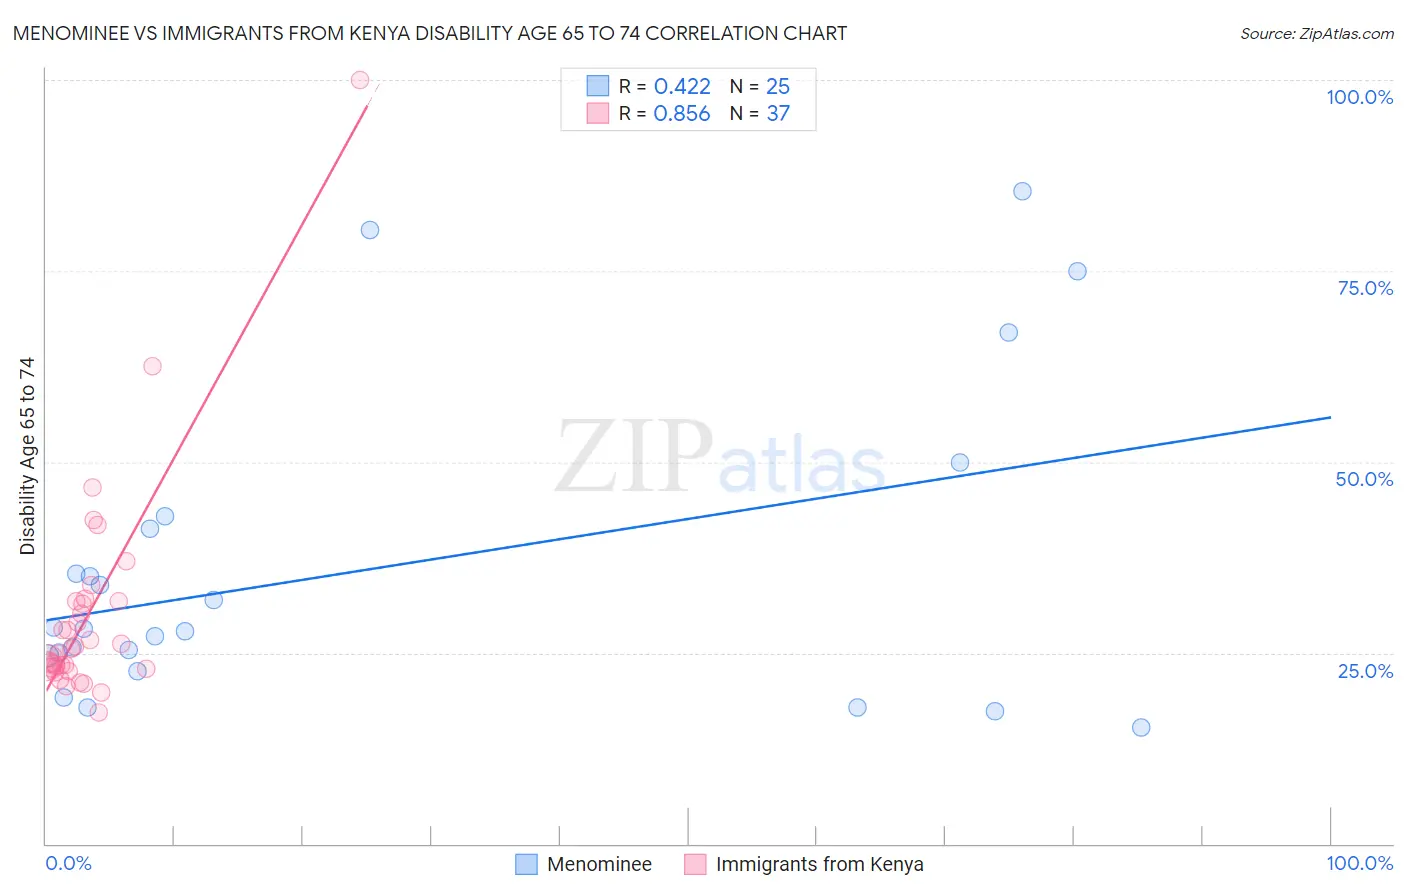
Menominee vs Immigrants from Kenya Disability Age 65 to 74 Correlation Chart
The statistical analysis conducted on geographies consisting of 45,777,170 people shows a moderate positive correlation between the proportion of Menominee and percentage of population with a disability between the ages 65 and 75 in the United States with a correlation coefficient (R) of 0.422 and weighted average of 27.4%. Similarly, the statistical analysis conducted on geographies consisting of 217,828,278 people shows a very strong positive correlation between the proportion of Immigrants from Kenya and percentage of population with a disability between the ages 65 and 75 in the United States with a correlation coefficient (R) of 0.856 and weighted average of 23.8%, a difference of 15.2%.
Disability Age 65 to 74 Correlation Summary
| Measurement | Menominee | Immigrants from Kenya |
| Minimum | 15.2% | 17.1% |
| Maximum | 85.4% | 100.0% |
| Range | 70.3% | 82.9% |
| Mean | 36.0% | 30.1% |
| Median | 28.1% | 25.6% |
| Interquartile 25% (IQ1) | 23.6% | 23.0% |
| Interquartile 75% (IQ3) | 42.1% | 31.8% |
| Interquartile Range (IQR) | 18.5% | 8.8% |
| Standard Deviation (Sample) | 20.2% | 14.7% |
| Standard Deviation (Population) | 19.8% | 14.5% |
Similar Demographics by Disability Age 65 to 74
Demographics Similar to Menominee by Disability Age 65 to 74
In terms of disability age 65 to 74, the demographic groups most similar to Menominee are Osage (27.5%, a difference of 0.080%), Shoshone (27.4%, a difference of 0.23%), Yaqui (27.4%, a difference of 0.27%), Sioux (27.3%, a difference of 0.34%), and Ute (27.3%, a difference of 0.49%).
| Demographics | Rating | Rank | Disability Age 65 to 74 |
| Puget Sound Salish | 0.0 /100 | #304 | Tragic 27.2% |
| Mexicans | 0.0 /100 | #305 | Tragic 27.2% |
| Blacks/African Americans | 0.0 /100 | #306 | Tragic 27.3% |
| Ute | 0.0 /100 | #307 | Tragic 27.3% |
| Sioux | 0.0 /100 | #308 | Tragic 27.3% |
| Yaqui | 0.0 /100 | #309 | Tragic 27.4% |
| Shoshone | 0.0 /100 | #310 | Tragic 27.4% |
| Menominee | 0.0 /100 | #311 | Tragic 27.4% |
| Osage | 0.0 /100 | #312 | Tragic 27.5% |
| Paiute | 0.0 /100 | #313 | Tragic 27.8% |
| Chippewa | 0.0 /100 | #314 | Tragic 27.8% |
| Cajuns | 0.0 /100 | #315 | Tragic 27.9% |
| Crow | 0.0 /100 | #316 | Tragic 27.9% |
| Immigrants | Armenia | 0.0 /100 | #317 | Tragic 28.0% |
| Nepalese | 0.0 /100 | #318 | Tragic 28.0% |
Demographics Similar to Immigrants from Kenya by Disability Age 65 to 74
In terms of disability age 65 to 74, the demographic groups most similar to Immigrants from Kenya are Immigrants from Barbados (23.8%, a difference of 0.0%), Immigrants from Sudan (23.8%, a difference of 0.050%), Tongan (23.8%, a difference of 0.11%), Immigrants from Jamaica (23.8%, a difference of 0.11%), and Immigrants from Grenada (23.8%, a difference of 0.22%).
| Demographics | Rating | Rank | Disability Age 65 to 74 |
| Immigrants | Bahamas | 23.3 /100 | #202 | Fair 23.7% |
| Kenyans | 23.2 /100 | #203 | Fair 23.7% |
| Immigrants | Grenada | 22.1 /100 | #204 | Fair 23.8% |
| Tongans | 20.8 /100 | #205 | Fair 23.8% |
| Immigrants | Jamaica | 20.7 /100 | #206 | Fair 23.8% |
| Immigrants | Sudan | 20.1 /100 | #207 | Fair 23.8% |
| Immigrants | Barbados | 19.6 /100 | #208 | Poor 23.8% |
| Immigrants | Kenya | 19.6 /100 | #209 | Poor 23.8% |
| Trinidadians and Tobagonians | 16.4 /100 | #210 | Poor 23.9% |
| Immigrants | West Indies | 15.9 /100 | #211 | Poor 23.9% |
| French | 15.7 /100 | #212 | Poor 23.9% |
| Nicaraguans | 14.3 /100 | #213 | Poor 23.9% |
| Immigrants | Oceania | 13.6 /100 | #214 | Poor 24.0% |
| Pennsylvania Germans | 13.3 /100 | #215 | Poor 24.0% |
| Jamaicans | 12.2 /100 | #216 | Poor 24.0% |