Nigerian vs Immigrants from Australia Disability Age 65 to 74
COMPARE
Nigerian
Immigrants from Australia
Disability Age 65 to 74
Disability Age 65 to 74 Comparison
Nigerians
Immigrants from Australia
24.2%
DISABILITY AGE 65 TO 74
7.8/ 100
METRIC RATING
227th/ 347
METRIC RANK
21.0%
DISABILITY AGE 65 TO 74
99.9/ 100
METRIC RATING
26th/ 347
METRIC RANK
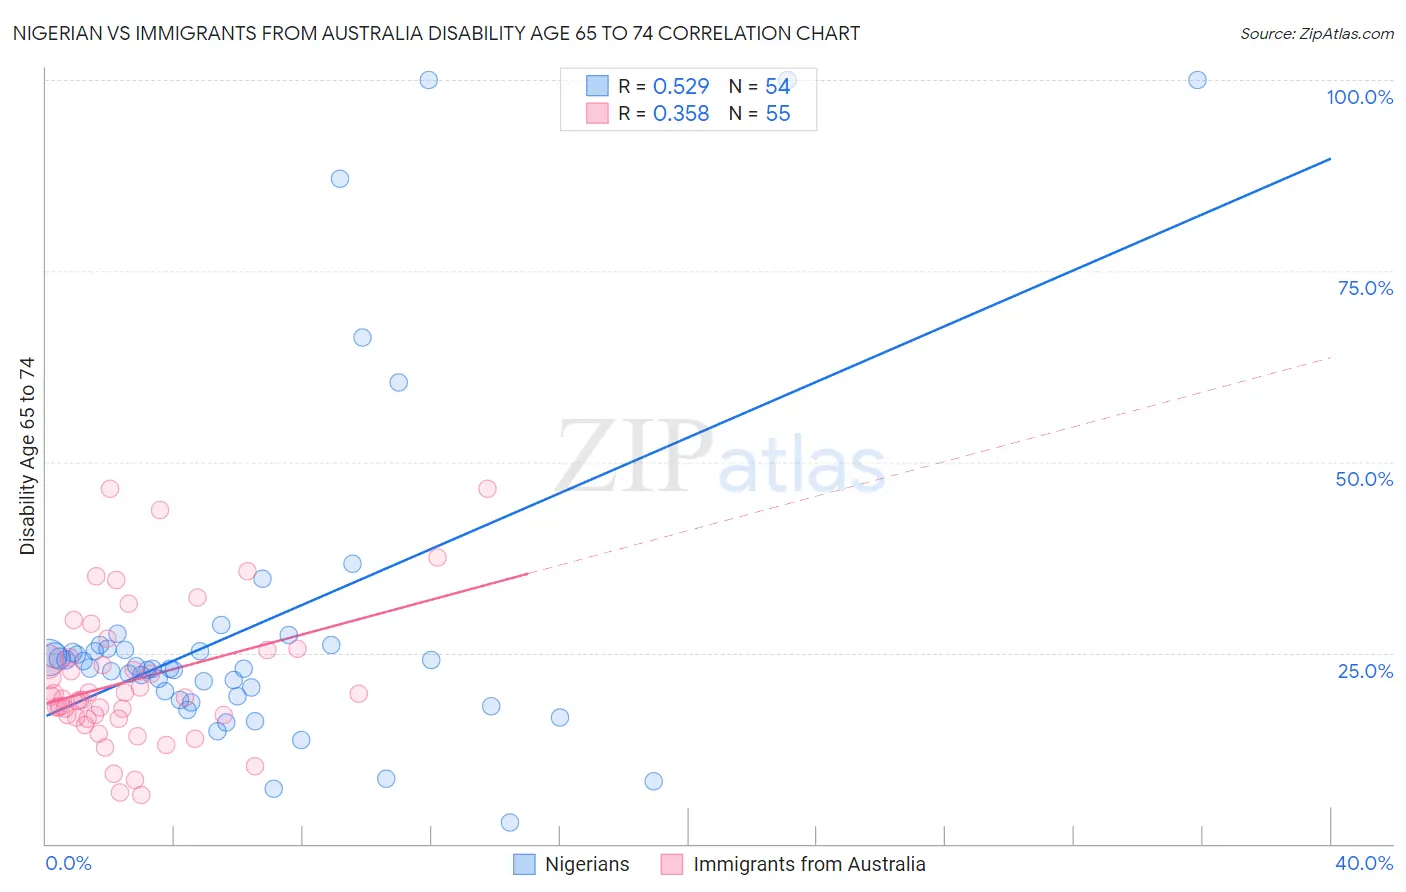
Nigerian vs Immigrants from Australia Disability Age 65 to 74 Correlation Chart
The statistical analysis conducted on geographies consisting of 331,948,820 people shows a substantial positive correlation between the proportion of Nigerians and percentage of population with a disability between the ages 65 and 75 in the United States with a correlation coefficient (R) of 0.529 and weighted average of 24.2%. Similarly, the statistical analysis conducted on geographies consisting of 226,981,660 people shows a mild positive correlation between the proportion of Immigrants from Australia and percentage of population with a disability between the ages 65 and 75 in the United States with a correlation coefficient (R) of 0.358 and weighted average of 21.0%, a difference of 15.3%.
Disability Age 65 to 74 Correlation Summary
| Measurement | Nigerian | Immigrants from Australia |
| Minimum | 2.8% | 6.4% |
| Maximum | 100.0% | 46.4% |
| Range | 97.2% | 40.0% |
| Mean | 28.6% | 21.5% |
| Median | 23.0% | 19.2% |
| Interquartile 25% (IQ1) | 19.3% | 16.6% |
| Interquartile 75% (IQ3) | 25.6% | 25.3% |
| Interquartile Range (IQR) | 6.4% | 8.7% |
| Standard Deviation (Sample) | 21.9% | 9.1% |
| Standard Deviation (Population) | 21.7% | 9.0% |
Similar Demographics by Disability Age 65 to 74
Demographics Similar to Nigerians by Disability Age 65 to 74
In terms of disability age 65 to 74, the demographic groups most similar to Nigerians are Bermudan (24.2%, a difference of 0.070%), Iraqi (24.2%, a difference of 0.070%), Immigrants from Panama (24.1%, a difference of 0.16%), Immigrants from Middle Africa (24.1%, a difference of 0.21%), and White/Caucasian (24.2%, a difference of 0.25%).
| Demographics | Rating | Rank | Disability Age 65 to 74 |
| Ghanaians | 10.4 /100 | #220 | Poor 24.1% |
| Immigrants | Nicaragua | 9.8 /100 | #221 | Tragic 24.1% |
| Native Hawaiians | 9.3 /100 | #222 | Tragic 24.1% |
| Immigrants | Middle Africa | 8.9 /100 | #223 | Tragic 24.1% |
| Immigrants | Panama | 8.6 /100 | #224 | Tragic 24.1% |
| Bermudans | 8.2 /100 | #225 | Tragic 24.2% |
| Iraqis | 8.1 /100 | #226 | Tragic 24.2% |
| Nigerians | 7.8 /100 | #227 | Tragic 24.2% |
| Whites/Caucasians | 6.6 /100 | #228 | Tragic 24.2% |
| Celtics | 6.4 /100 | #229 | Tragic 24.2% |
| Barbadians | 6.0 /100 | #230 | Tragic 24.3% |
| Immigrants | Thailand | 5.2 /100 | #231 | Tragic 24.3% |
| Immigrants | Zaire | 5.0 /100 | #232 | Tragic 24.3% |
| Bahamians | 4.5 /100 | #233 | Tragic 24.4% |
| Panamanians | 4.2 /100 | #234 | Tragic 24.4% |
Demographics Similar to Immigrants from Australia by Disability Age 65 to 74
In terms of disability age 65 to 74, the demographic groups most similar to Immigrants from Australia are Bolivian (21.0%, a difference of 0.020%), Immigrants from Sweden (21.0%, a difference of 0.020%), Soviet Union (21.0%, a difference of 0.060%), Immigrants from Belgium (21.0%, a difference of 0.11%), and Immigrants from Czechoslovakia (21.0%, a difference of 0.11%).
| Demographics | Rating | Rank | Disability Age 65 to 74 |
| Burmese | 100.0 /100 | #19 | Exceptional 20.6% |
| Okinawans | 100.0 /100 | #20 | Exceptional 20.7% |
| Immigrants | Bolivia | 99.9 /100 | #21 | Exceptional 20.8% |
| Immigrants | Iran | 99.9 /100 | #22 | Exceptional 20.9% |
| Immigrants | Belgium | 99.9 /100 | #23 | Exceptional 21.0% |
| Soviet Union | 99.9 /100 | #24 | Exceptional 21.0% |
| Bolivians | 99.9 /100 | #25 | Exceptional 21.0% |
| Immigrants | Australia | 99.9 /100 | #26 | Exceptional 21.0% |
| Immigrants | Sweden | 99.9 /100 | #27 | Exceptional 21.0% |
| Immigrants | Czechoslovakia | 99.9 /100 | #28 | Exceptional 21.0% |
| Immigrants | Japan | 99.9 /100 | #29 | Exceptional 21.0% |
| Immigrants | Greece | 99.9 /100 | #30 | Exceptional 21.0% |
| Immigrants | Northern Europe | 99.9 /100 | #31 | Exceptional 21.0% |
| Turks | 99.9 /100 | #32 | Exceptional 21.0% |
| Immigrants | Argentina | 99.9 /100 | #33 | Exceptional 21.1% |