Immigrants from Bolivia vs Immigrants from Croatia Disability Age 35 to 64
COMPARE
Immigrants from Bolivia
Immigrants from Croatia
Disability Age 35 to 64
Disability Age 35 to 64 Comparison
Immigrants from Bolivia
Immigrants from Croatia
8.7%
DISABILITY AGE 35 TO 64
100.0/ 100
METRIC RATING
10th/ 347
METRIC RANK
10.2%
DISABILITY AGE 35 TO 64
99.3/ 100
METRIC RATING
80th/ 347
METRIC RANK
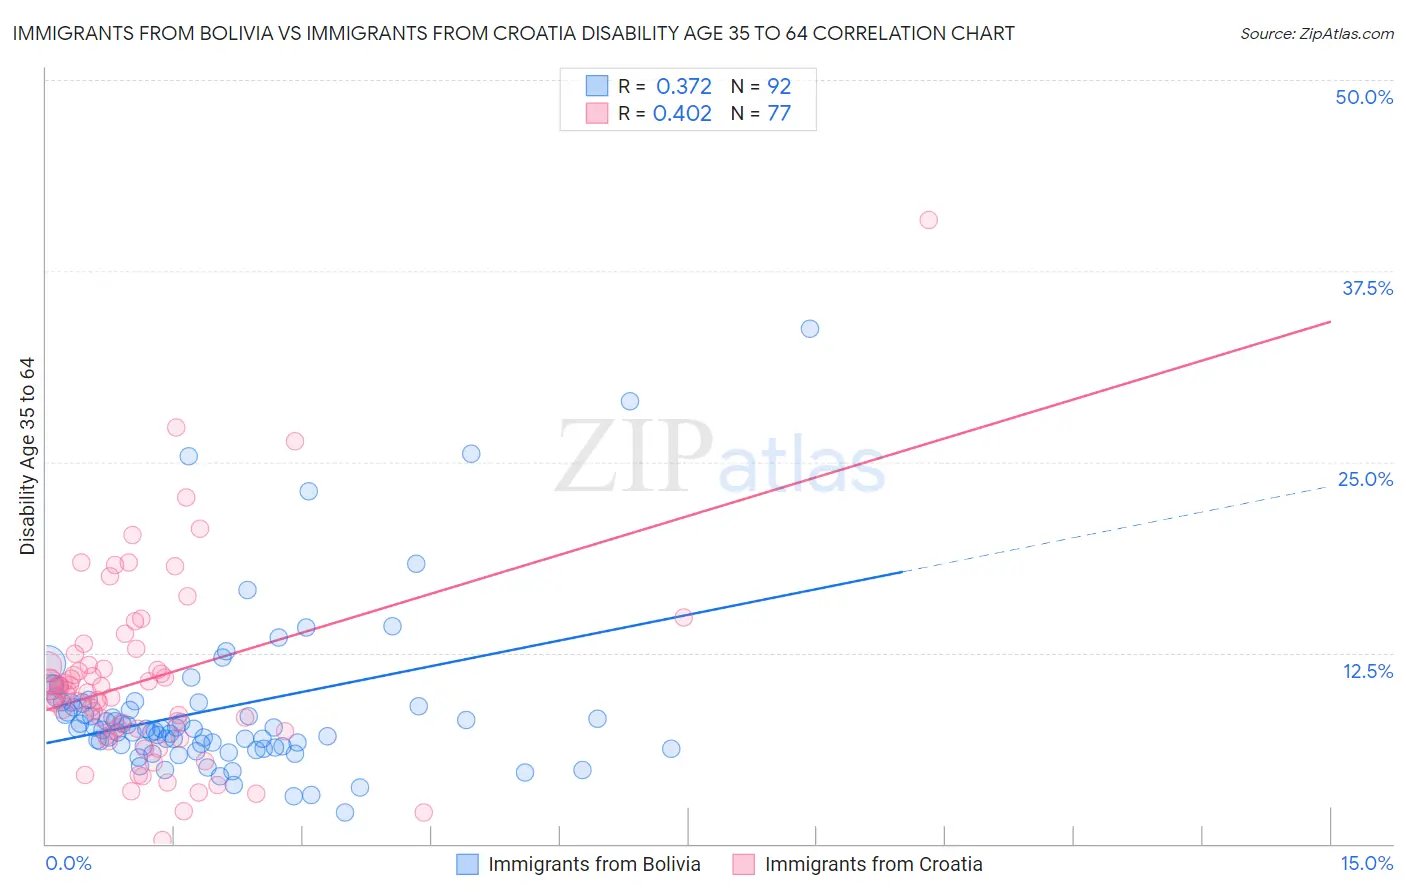
Immigrants from Bolivia vs Immigrants from Croatia Disability Age 35 to 64 Correlation Chart
The statistical analysis conducted on geographies consisting of 158,698,949 people shows a mild positive correlation between the proportion of Immigrants from Bolivia and percentage of population with a disability between the ages 34 and 64 in the United States with a correlation coefficient (R) of 0.372 and weighted average of 8.7%. Similarly, the statistical analysis conducted on geographies consisting of 132,570,235 people shows a moderate positive correlation between the proportion of Immigrants from Croatia and percentage of population with a disability between the ages 34 and 64 in the United States with a correlation coefficient (R) of 0.402 and weighted average of 10.2%, a difference of 16.5%.
Disability Age 35 to 64 Correlation Summary
| Measurement | Immigrants from Bolivia | Immigrants from Croatia |
| Minimum | 2.0% | 0.25% |
| Maximum | 33.7% | 40.9% |
| Range | 31.7% | 40.6% |
| Mean | 8.8% | 10.8% |
| Median | 7.5% | 9.9% |
| Interquartile 25% (IQ1) | 6.4% | 7.3% |
| Interquartile 75% (IQ3) | 9.2% | 12.0% |
| Interquartile Range (IQR) | 2.9% | 4.7% |
| Standard Deviation (Sample) | 5.3% | 6.3% |
| Standard Deviation (Population) | 5.2% | 6.3% |
Similar Demographics by Disability Age 35 to 64
Demographics Similar to Immigrants from Bolivia by Disability Age 35 to 64
In terms of disability age 35 to 64, the demographic groups most similar to Immigrants from Bolivia are Immigrants from China (8.7%, a difference of 0.27%), Iranian (8.7%, a difference of 0.70%), Immigrants from Eastern Asia (8.8%, a difference of 0.70%), Immigrants from Israel (8.6%, a difference of 1.3%), and Indian (Asian) (8.9%, a difference of 1.5%).
| Demographics | Rating | Rank | Disability Age 35 to 64 |
| Immigrants | Hong Kong | 100.0 /100 | #3 | Exceptional 8.2% |
| Immigrants | India | 100.0 /100 | #4 | Exceptional 8.3% |
| Immigrants | Iran | 100.0 /100 | #5 | Exceptional 8.5% |
| Thais | 100.0 /100 | #6 | Exceptional 8.6% |
| Immigrants | Israel | 100.0 /100 | #7 | Exceptional 8.6% |
| Iranians | 100.0 /100 | #8 | Exceptional 8.7% |
| Immigrants | China | 100.0 /100 | #9 | Exceptional 8.7% |
| Immigrants | Bolivia | 100.0 /100 | #10 | Exceptional 8.7% |
| Immigrants | Eastern Asia | 100.0 /100 | #11 | Exceptional 8.8% |
| Indians (Asian) | 100.0 /100 | #12 | Exceptional 8.9% |
| Immigrants | South Central Asia | 100.0 /100 | #13 | Exceptional 8.9% |
| Immigrants | Singapore | 100.0 /100 | #14 | Exceptional 8.9% |
| Bolivians | 100.0 /100 | #15 | Exceptional 8.9% |
| Immigrants | Korea | 100.0 /100 | #16 | Exceptional 9.0% |
| Burmese | 100.0 /100 | #17 | Exceptional 9.2% |
Demographics Similar to Immigrants from Croatia by Disability Age 35 to 64
In terms of disability age 35 to 64, the demographic groups most similar to Immigrants from Croatia are Latvian (10.2%, a difference of 0.10%), Immigrants from Vietnam (10.1%, a difference of 0.13%), Russian (10.2%, a difference of 0.16%), Immigrants from Brazil (10.2%, a difference of 0.17%), and Jordanian (10.1%, a difference of 0.20%).
| Demographics | Rating | Rank | Disability Age 35 to 64 |
| Immigrants | France | 99.5 /100 | #73 | Exceptional 10.1% |
| Laotians | 99.4 /100 | #74 | Exceptional 10.1% |
| Immigrants | Latvia | 99.4 /100 | #75 | Exceptional 10.1% |
| Immigrants | Chile | 99.4 /100 | #76 | Exceptional 10.1% |
| Mongolians | 99.4 /100 | #77 | Exceptional 10.1% |
| Jordanians | 99.3 /100 | #78 | Exceptional 10.1% |
| Immigrants | Vietnam | 99.3 /100 | #79 | Exceptional 10.1% |
| Immigrants | Croatia | 99.3 /100 | #80 | Exceptional 10.2% |
| Latvians | 99.2 /100 | #81 | Exceptional 10.2% |
| Russians | 99.2 /100 | #82 | Exceptional 10.2% |
| Immigrants | Brazil | 99.2 /100 | #83 | Exceptional 10.2% |
| Sri Lankans | 99.2 /100 | #84 | Exceptional 10.2% |
| Immigrants | Kuwait | 99.1 /100 | #85 | Exceptional 10.2% |
| Immigrants | Europe | 99.1 /100 | #86 | Exceptional 10.2% |
| Nicaraguans | 99.1 /100 | #87 | Exceptional 10.2% |