Nicaraguan vs Cape Verdean Cognitive Disability
COMPARE
Nicaraguan
Cape Verdean
Cognitive Disability
Cognitive Disability Comparison
Nicaraguans
Cape Verdeans
17.0%
COGNITIVE DISABILITY
93.0/ 100
METRIC RATING
128th/ 347
METRIC RANK
19.2%
COGNITIVE DISABILITY
0.0/ 100
METRIC RATING
340th/ 347
METRIC RANK
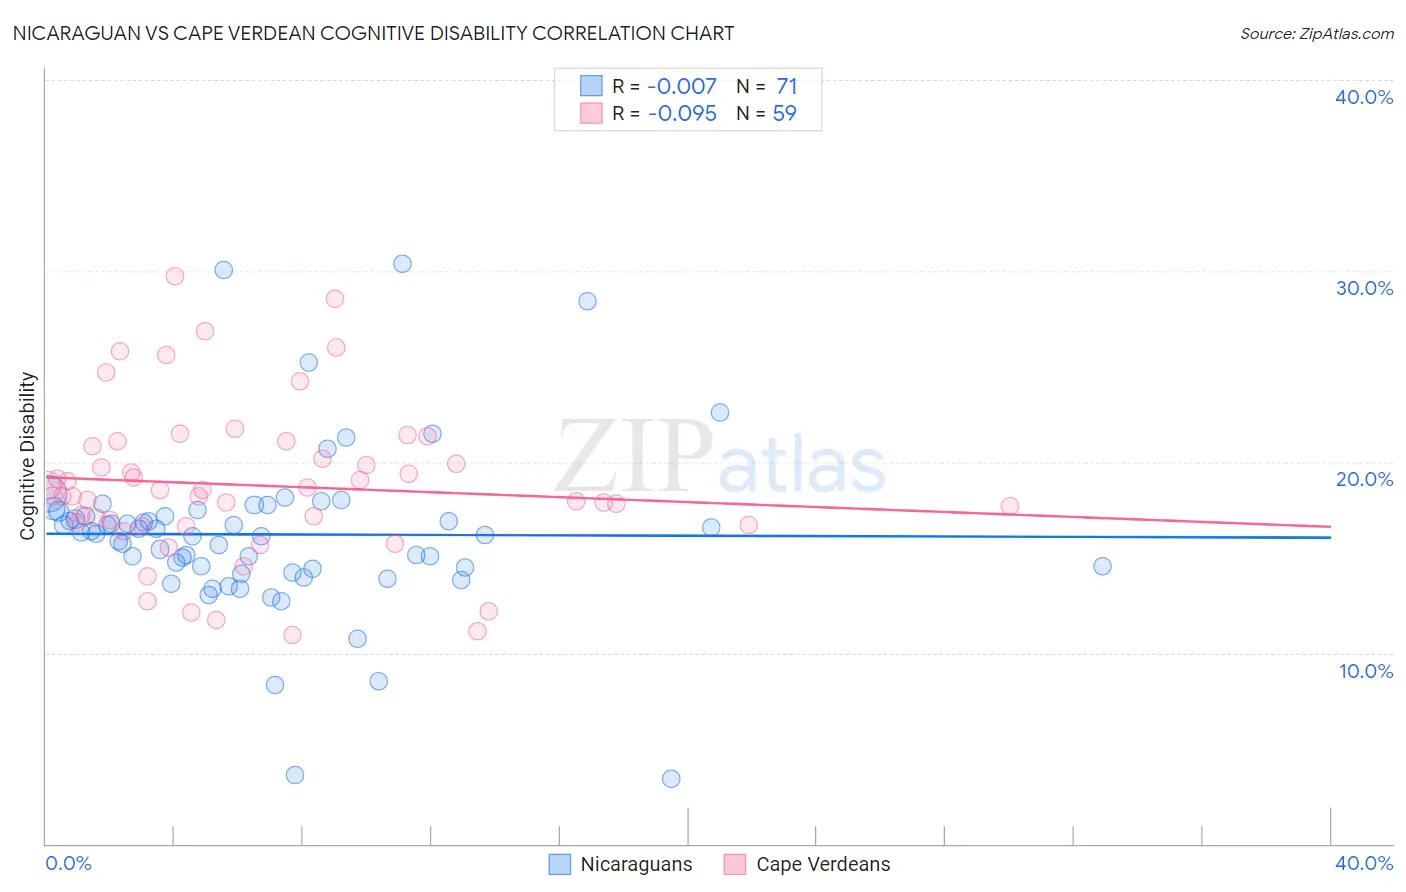
Nicaraguan vs Cape Verdean Cognitive Disability Correlation Chart
The statistical analysis conducted on geographies consisting of 285,693,430 people shows no correlation between the proportion of Nicaraguans and percentage of population with cognitive disability in the United States with a correlation coefficient (R) of -0.007 and weighted average of 17.0%. Similarly, the statistical analysis conducted on geographies consisting of 107,569,926 people shows a slight negative correlation between the proportion of Cape Verdeans and percentage of population with cognitive disability in the United States with a correlation coefficient (R) of -0.095 and weighted average of 19.2%, a difference of 13.3%.
Cognitive Disability Correlation Summary
| Measurement | Nicaraguan | Cape Verdean |
| Minimum | 3.4% | 10.9% |
| Maximum | 30.4% | 29.8% |
| Range | 26.9% | 18.8% |
| Mean | 16.2% | 18.8% |
| Median | 16.2% | 18.2% |
| Interquartile 25% (IQ1) | 14.4% | 16.7% |
| Interquartile 75% (IQ3) | 17.4% | 20.8% |
| Interquartile Range (IQR) | 3.0% | 4.1% |
| Standard Deviation (Sample) | 4.4% | 4.0% |
| Standard Deviation (Population) | 4.4% | 4.0% |
Similar Demographics by Cognitive Disability
Demographics Similar to Nicaraguans by Cognitive Disability
In terms of cognitive disability, the demographic groups most similar to Nicaraguans are Immigrants from Costa Rica (17.0%, a difference of 0.010%), Immigrants from Uruguay (17.0%, a difference of 0.010%), European (17.0%, a difference of 0.050%), Immigrants from Vietnam (17.0%, a difference of 0.070%), and Immigrants from Germany (17.0%, a difference of 0.090%).
| Demographics | Rating | Rank | Cognitive Disability |
| Immigrants | China | 94.9 /100 | #121 | Exceptional 16.9% |
| Immigrants | Western Europe | 94.8 /100 | #122 | Exceptional 16.9% |
| Portuguese | 94.7 /100 | #123 | Exceptional 16.9% |
| Turks | 94.5 /100 | #124 | Exceptional 16.9% |
| Scandinavians | 94.1 /100 | #125 | Exceptional 16.9% |
| Europeans | 93.4 /100 | #126 | Exceptional 17.0% |
| Immigrants | Costa Rica | 93.1 /100 | #127 | Exceptional 17.0% |
| Nicaraguans | 93.0 /100 | #128 | Exceptional 17.0% |
| Immigrants | Uruguay | 92.9 /100 | #129 | Exceptional 17.0% |
| Immigrants | Vietnam | 92.4 /100 | #130 | Exceptional 17.0% |
| Immigrants | Germany | 92.1 /100 | #131 | Exceptional 17.0% |
| Whites/Caucasians | 92.1 /100 | #132 | Exceptional 17.0% |
| Immigrants | Jordan | 91.9 /100 | #133 | Exceptional 17.0% |
| Immigrants | Chile | 91.7 /100 | #134 | Exceptional 17.0% |
| Lebanese | 91.3 /100 | #135 | Exceptional 17.0% |
Demographics Similar to Cape Verdeans by Cognitive Disability
In terms of cognitive disability, the demographic groups most similar to Cape Verdeans are Puerto Rican (19.2%, a difference of 0.020%), Tohono O'odham (19.3%, a difference of 0.24%), Houma (19.3%, a difference of 0.24%), Lumbee (19.1%, a difference of 0.50%), and Immigrants from Saudi Arabia (19.1%, a difference of 0.84%).
| Demographics | Rating | Rank | Cognitive Disability |
| Immigrants | Yemen | 0.0 /100 | #333 | Tragic 18.8% |
| Sudanese | 0.0 /100 | #334 | Tragic 18.9% |
| Senegalese | 0.0 /100 | #335 | Tragic 19.0% |
| Blacks/African Americans | 0.0 /100 | #336 | Tragic 19.0% |
| Immigrants | Saudi Arabia | 0.0 /100 | #337 | Tragic 19.1% |
| Lumbee | 0.0 /100 | #338 | Tragic 19.1% |
| Puerto Ricans | 0.0 /100 | #339 | Tragic 19.2% |
| Cape Verdeans | 0.0 /100 | #340 | Tragic 19.2% |
| Tohono O'odham | 0.0 /100 | #341 | Tragic 19.3% |
| Houma | 0.0 /100 | #342 | Tragic 19.3% |
| Immigrants | Zaire | 0.0 /100 | #343 | Tragic 19.4% |
| Immigrants | Congo | 0.0 /100 | #344 | Tragic 19.7% |
| Somalis | 0.0 /100 | #345 | Tragic 19.8% |
| Immigrants | Cabo Verde | 0.0 /100 | #346 | Tragic 19.9% |
| Immigrants | Somalia | 0.0 /100 | #347 | Tragic 20.0% |