Nicaraguan vs Navajo Per Capita Income
COMPARE
Nicaraguan
Navajo
Per Capita Income
Per Capita Income Comparison
Nicaraguans
Navajo
$39,372
PER CAPITA INCOME
0.8/ 100
METRIC RATING
257th/ 347
METRIC RANK
$29,031
PER CAPITA INCOME
0.0/ 100
METRIC RATING
347th/ 347
METRIC RANK
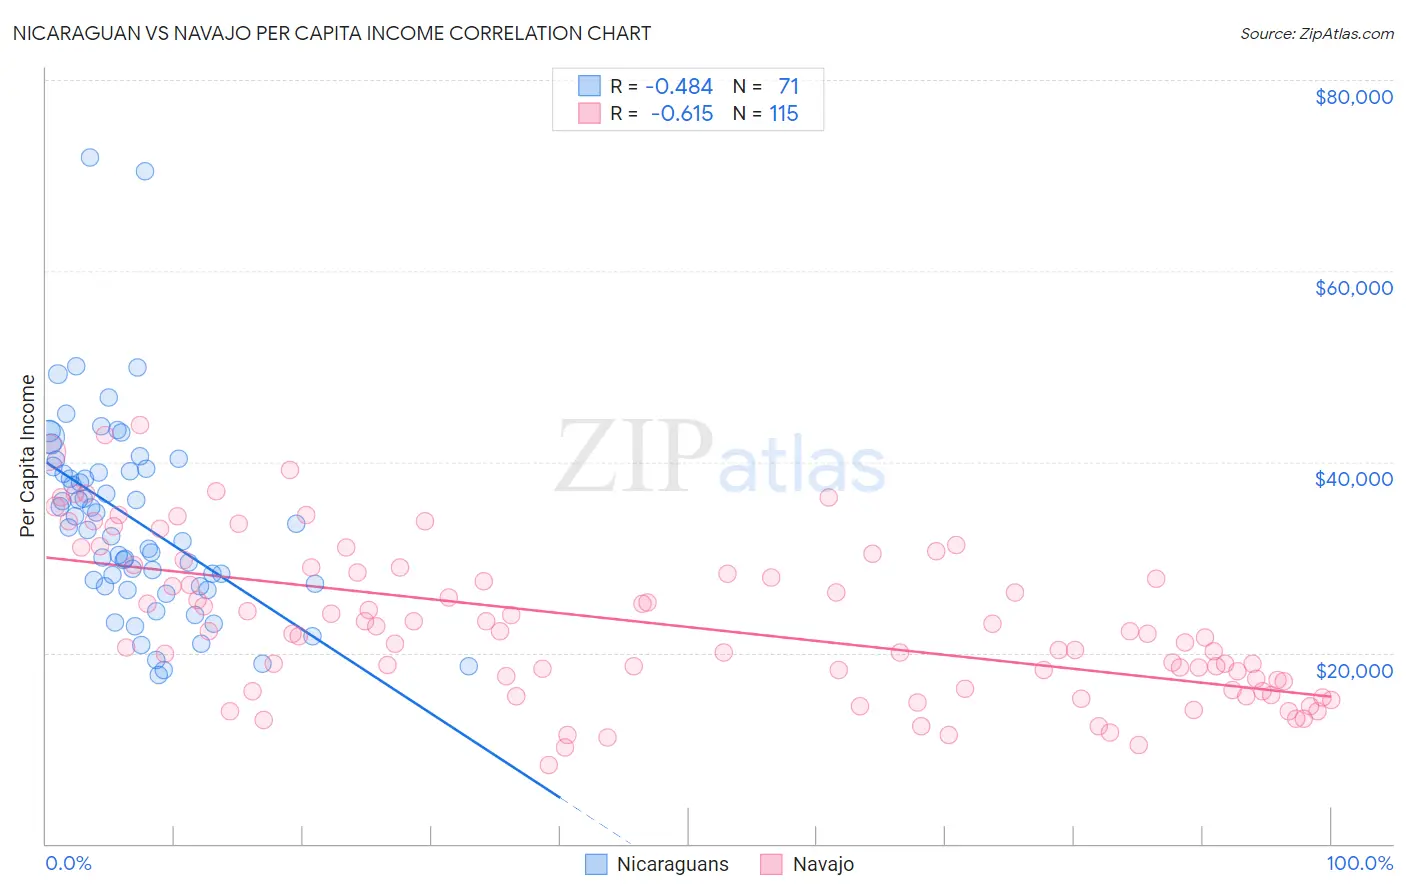
Nicaraguan vs Navajo Per Capita Income Correlation Chart
The statistical analysis conducted on geographies consisting of 285,722,062 people shows a moderate negative correlation between the proportion of Nicaraguans and per capita income in the United States with a correlation coefficient (R) of -0.484 and weighted average of $39,372. Similarly, the statistical analysis conducted on geographies consisting of 224,872,448 people shows a significant negative correlation between the proportion of Navajo and per capita income in the United States with a correlation coefficient (R) of -0.615 and weighted average of $29,031, a difference of 35.6%.
Per Capita Income Correlation Summary
| Measurement | Nicaraguan | Navajo |
| Minimum | $17,623 | $8,247 |
| Maximum | $71,864 | $43,851 |
| Range | $54,241 | $35,604 |
| Mean | $33,908 | $22,991 |
| Median | $33,140 | $21,965 |
| Interquartile 25% (IQ1) | $27,013 | $16,235 |
| Interquartile 75% (IQ3) | $39,273 | $28,907 |
| Interquartile Range (IQR) | $12,260 | $12,672 |
| Standard Deviation (Sample) | $10,352 | $8,079 |
| Standard Deviation (Population) | $10,279 | $8,043 |
Similar Demographics by Per Capita Income
Demographics Similar to Nicaraguans by Per Capita Income
In terms of per capita income, the demographic groups most similar to Nicaraguans are Hawaiian ($39,403, a difference of 0.080%), Jamaican ($39,231, a difference of 0.36%), Immigrants from Middle Africa ($39,529, a difference of 0.40%), Malaysian ($39,194, a difference of 0.46%), and Alaska Native ($39,558, a difference of 0.47%).
| Demographics | Rating | Rank | Per Capita Income |
| Immigrants | Burma/Myanmar | 1.3 /100 | #250 | Tragic $39,827 |
| Samoans | 1.3 /100 | #251 | Tragic $39,826 |
| Immigrants | Azores | 1.0 /100 | #252 | Tragic $39,608 |
| Osage | 1.0 /100 | #253 | Tragic $39,568 |
| Alaska Natives | 1.0 /100 | #254 | Tragic $39,558 |
| Immigrants | Middle Africa | 1.0 /100 | #255 | Tragic $39,529 |
| Hawaiians | 0.8 /100 | #256 | Tragic $39,403 |
| Nicaraguans | 0.8 /100 | #257 | Tragic $39,372 |
| Jamaicans | 0.7 /100 | #258 | Tragic $39,231 |
| Malaysians | 0.7 /100 | #259 | Tragic $39,194 |
| Alaskan Athabascans | 0.6 /100 | #260 | Tragic $39,163 |
| Marshallese | 0.6 /100 | #261 | Tragic $39,108 |
| Iroquois | 0.6 /100 | #262 | Tragic $39,104 |
| Belizeans | 0.6 /100 | #263 | Tragic $39,097 |
| Americans | 0.6 /100 | #264 | Tragic $39,039 |
Demographics Similar to Navajo by Per Capita Income
In terms of per capita income, the demographic groups most similar to Navajo are Lumbee ($29,845, a difference of 2.8%), Tohono O'odham ($30,256, a difference of 4.2%), Yup'ik ($30,518, a difference of 5.1%), Pima ($30,644, a difference of 5.6%), and Hopi ($31,177, a difference of 7.4%).
| Demographics | Rating | Rank | Per Capita Income |
| Immigrants | Yemen | 0.0 /100 | #333 | Tragic $33,696 |
| Natives/Alaskans | 0.0 /100 | #334 | Tragic $33,279 |
| Yuman | 0.0 /100 | #335 | Tragic $33,236 |
| Yakama | 0.0 /100 | #336 | Tragic $33,009 |
| Houma | 0.0 /100 | #337 | Tragic $32,996 |
| Arapaho | 0.0 /100 | #338 | Tragic $32,345 |
| Pueblo | 0.0 /100 | #339 | Tragic $32,012 |
| Crow | 0.0 /100 | #340 | Tragic $31,729 |
| Puerto Ricans | 0.0 /100 | #341 | Tragic $31,268 |
| Hopi | 0.0 /100 | #342 | Tragic $31,177 |
| Pima | 0.0 /100 | #343 | Tragic $30,644 |
| Yup'ik | 0.0 /100 | #344 | Tragic $30,518 |
| Tohono O'odham | 0.0 /100 | #345 | Tragic $30,256 |
| Lumbee | 0.0 /100 | #346 | Tragic $29,845 |
| Navajo | 0.0 /100 | #347 | Tragic $29,031 |