Ecuadorian vs Immigrants from Belarus Disability Age 18 to 34
COMPARE
Ecuadorian
Immigrants from Belarus
Disability Age 18 to 34
Disability Age 18 to 34 Comparison
Ecuadorians
Immigrants from Belarus
5.8%
DISABILITY AGE 18 TO 34
99.9/ 100
METRIC RATING
36th/ 347
METRIC RANK
5.9%
DISABILITY AGE 18 TO 34
99.8/ 100
METRIC RATING
49th/ 347
METRIC RANK
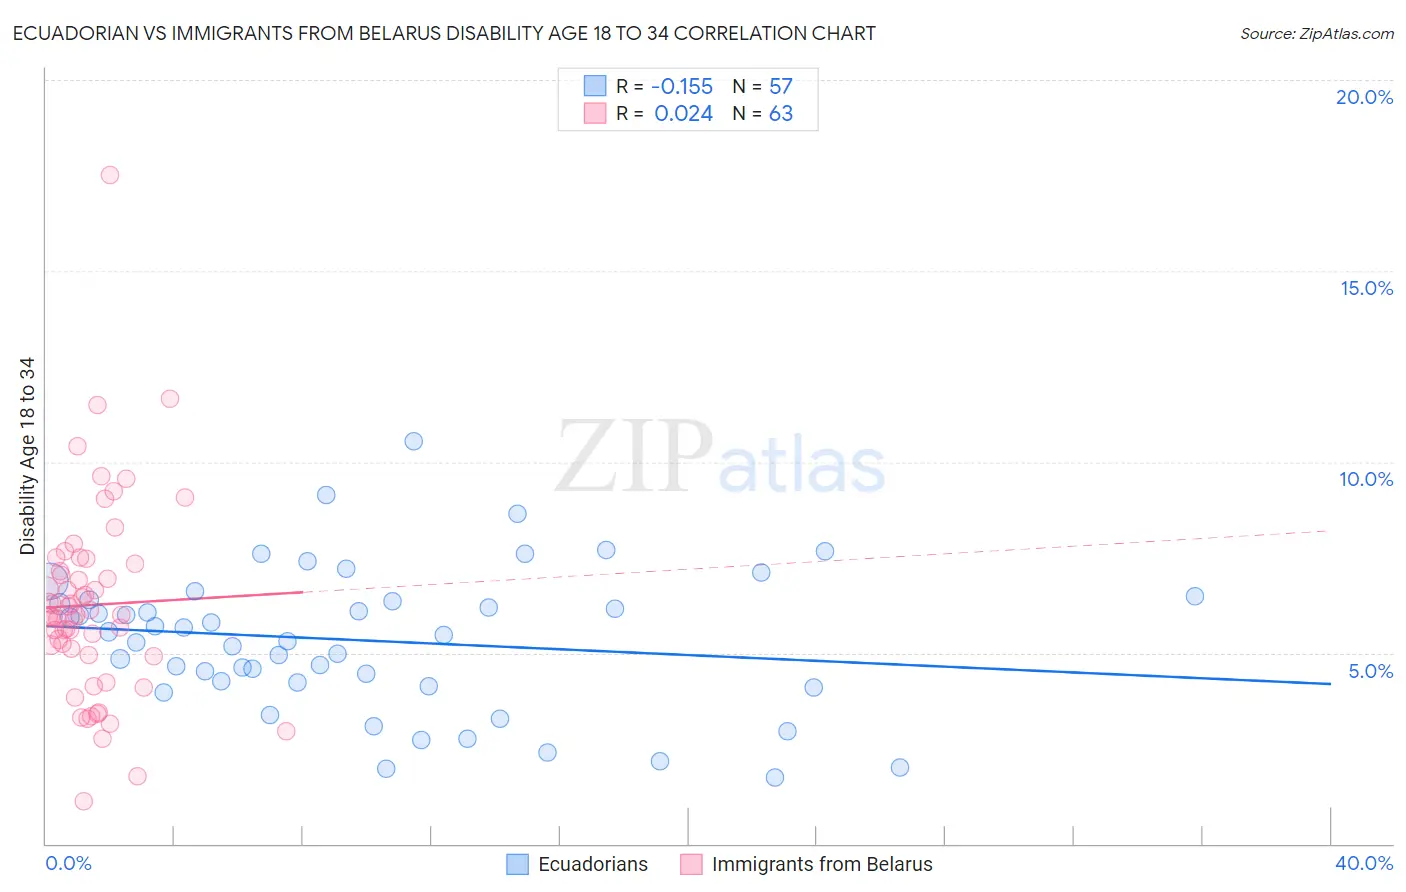
Ecuadorian vs Immigrants from Belarus Disability Age 18 to 34 Correlation Chart
The statistical analysis conducted on geographies consisting of 317,415,300 people shows a poor negative correlation between the proportion of Ecuadorians and percentage of population with a disability between the ages 18 and 35 in the United States with a correlation coefficient (R) of -0.155 and weighted average of 5.8%. Similarly, the statistical analysis conducted on geographies consisting of 150,056,630 people shows no correlation between the proportion of Immigrants from Belarus and percentage of population with a disability between the ages 18 and 35 in the United States with a correlation coefficient (R) of 0.024 and weighted average of 5.9%, a difference of 1.8%.
Disability Age 18 to 34 Correlation Summary
| Measurement | Ecuadorian | Immigrants from Belarus |
| Minimum | 1.7% | 1.1% |
| Maximum | 10.5% | 17.5% |
| Range | 8.8% | 16.4% |
| Mean | 5.3% | 6.3% |
| Median | 5.5% | 6.0% |
| Interquartile 25% (IQ1) | 4.2% | 4.9% |
| Interquartile 75% (IQ3) | 6.4% | 7.3% |
| Interquartile Range (IQR) | 2.2% | 2.4% |
| Standard Deviation (Sample) | 1.9% | 2.6% |
| Standard Deviation (Population) | 1.9% | 2.6% |
Demographics Similar to Ecuadorians and Immigrants from Belarus by Disability Age 18 to 34
In terms of disability age 18 to 34, the demographic groups most similar to Ecuadorians are Armenian (5.8%, a difference of 0.090%), Immigrants from South America (5.8%, a difference of 0.11%), Immigrants from Lithuania (5.8%, a difference of 0.15%), Venezuelan (5.8%, a difference of 0.38%), and Asian (5.8%, a difference of 0.42%). Similarly, the demographic groups most similar to Immigrants from Belarus are Immigrants from El Salvador (5.9%, a difference of 0.040%), Egyptian (5.9%, a difference of 0.040%), Immigrants from Trinidad and Tobago (5.9%, a difference of 0.10%), Okinawan (5.9%, a difference of 0.18%), and Immigrants from Egypt (5.9%, a difference of 0.52%).
| Demographics | Rating | Rank | Disability Age 18 to 34 |
| Immigrants | Barbados | 99.9 /100 | #32 | Exceptional 5.8% |
| Argentineans | 99.9 /100 | #33 | Exceptional 5.8% |
| Venezuelans | 99.9 /100 | #34 | Exceptional 5.8% |
| Immigrants | Lithuania | 99.9 /100 | #35 | Exceptional 5.8% |
| Ecuadorians | 99.9 /100 | #36 | Exceptional 5.8% |
| Armenians | 99.9 /100 | #37 | Exceptional 5.8% |
| Immigrants | South America | 99.9 /100 | #38 | Exceptional 5.8% |
| Asians | 99.9 /100 | #39 | Exceptional 5.8% |
| Bolivians | 99.9 /100 | #40 | Exceptional 5.8% |
| Nicaraguans | 99.9 /100 | #41 | Exceptional 5.8% |
| Colombians | 99.8 /100 | #42 | Exceptional 5.9% |
| South Americans | 99.8 /100 | #43 | Exceptional 5.9% |
| Immigrants | Asia | 99.8 /100 | #44 | Exceptional 5.9% |
| Immigrants | Peru | 99.8 /100 | #45 | Exceptional 5.9% |
| Immigrants | Korea | 99.8 /100 | #46 | Exceptional 5.9% |
| Immigrants | Egypt | 99.8 /100 | #47 | Exceptional 5.9% |
| Immigrants | Trinidad and Tobago | 99.8 /100 | #48 | Exceptional 5.9% |
| Immigrants | Belarus | 99.8 /100 | #49 | Exceptional 5.9% |
| Immigrants | El Salvador | 99.8 /100 | #50 | Exceptional 5.9% |
| Egyptians | 99.8 /100 | #51 | Exceptional 5.9% |
| Okinawans | 99.7 /100 | #52 | Exceptional 5.9% |