Nicaraguan vs Immigrants from Burma/Myanmar Disability Age 18 to 34
COMPARE
Nicaraguan
Immigrants from Burma/Myanmar
Disability Age 18 to 34
Disability Age 18 to 34 Comparison
Nicaraguans
Immigrants from Burma/Myanmar
5.8%
DISABILITY AGE 18 TO 34
99.9/ 100
METRIC RATING
41st/ 347
METRIC RANK
6.8%
DISABILITY AGE 18 TO 34
12.3/ 100
METRIC RATING
209th/ 347
METRIC RANK
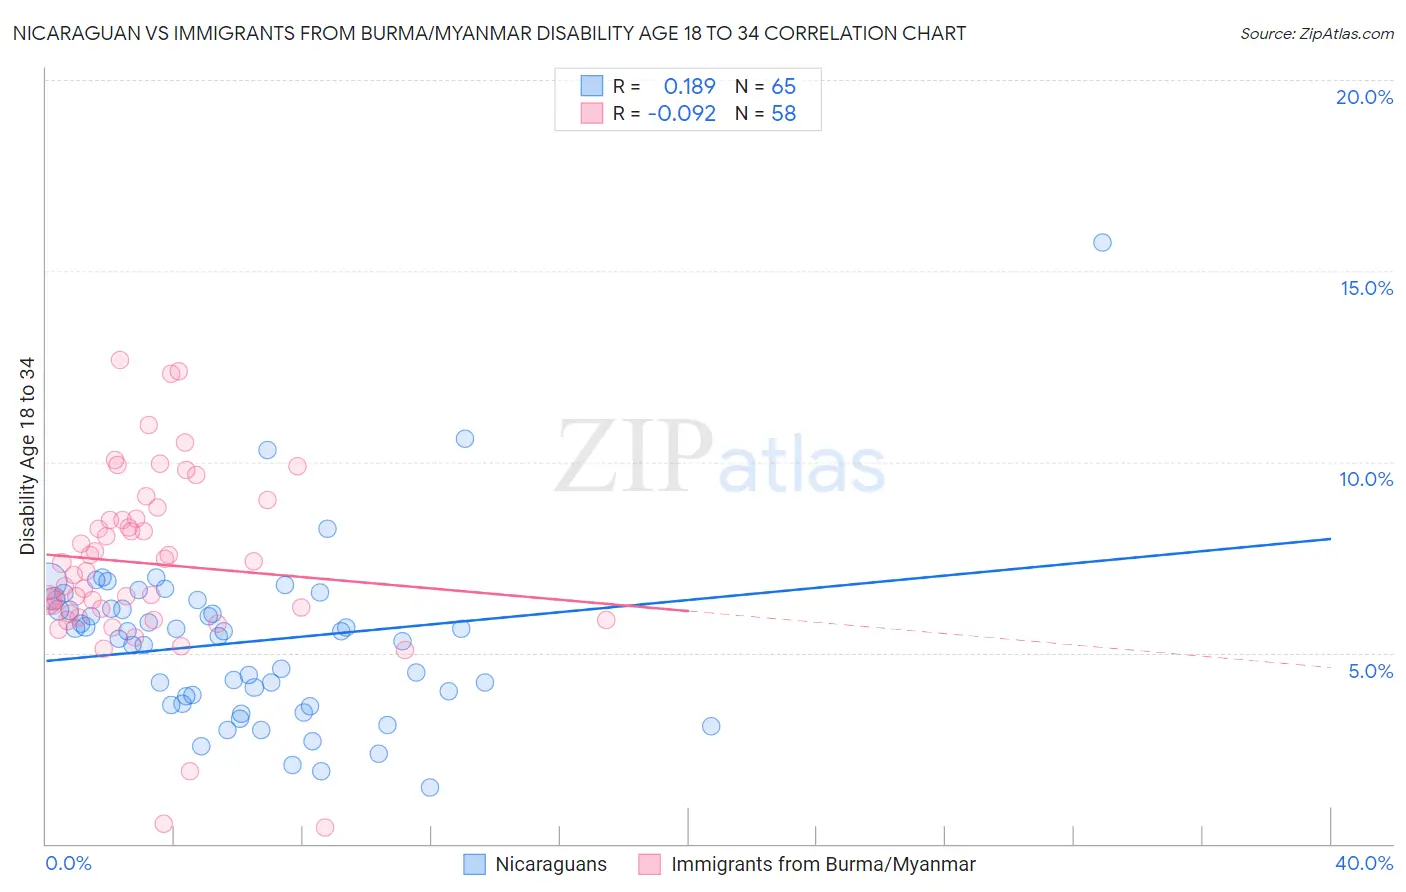
Nicaraguan vs Immigrants from Burma/Myanmar Disability Age 18 to 34 Correlation Chart
The statistical analysis conducted on geographies consisting of 285,455,320 people shows a poor positive correlation between the proportion of Nicaraguans and percentage of population with a disability between the ages 18 and 35 in the United States with a correlation coefficient (R) of 0.189 and weighted average of 5.8%. Similarly, the statistical analysis conducted on geographies consisting of 172,278,833 people shows a slight negative correlation between the proportion of Immigrants from Burma/Myanmar and percentage of population with a disability between the ages 18 and 35 in the United States with a correlation coefficient (R) of -0.092 and weighted average of 6.8%, a difference of 16.8%.
Disability Age 18 to 34 Correlation Summary
| Measurement | Nicaraguan | Immigrants from Burma/Myanmar |
| Minimum | 1.5% | 0.44% |
| Maximum | 15.7% | 12.7% |
| Range | 14.3% | 12.2% |
| Mean | 5.3% | 7.3% |
| Median | 5.6% | 7.2% |
| Interquartile 25% (IQ1) | 3.8% | 6.0% |
| Interquartile 75% (IQ3) | 6.3% | 8.5% |
| Interquartile Range (IQR) | 2.5% | 2.5% |
| Standard Deviation (Sample) | 2.2% | 2.4% |
| Standard Deviation (Population) | 2.2% | 2.4% |
Similar Demographics by Disability Age 18 to 34
Demographics Similar to Nicaraguans by Disability Age 18 to 34
In terms of disability age 18 to 34, the demographic groups most similar to Nicaraguans are Bolivian (5.8%, a difference of 0.18%), Colombian (5.9%, a difference of 0.22%), South American (5.9%, a difference of 0.23%), Immigrants from Asia (5.9%, a difference of 0.25%), and Asian (5.8%, a difference of 0.26%).
| Demographics | Rating | Rank | Disability Age 18 to 34 |
| Venezuelans | 99.9 /100 | #34 | Exceptional 5.8% |
| Immigrants | Lithuania | 99.9 /100 | #35 | Exceptional 5.8% |
| Ecuadorians | 99.9 /100 | #36 | Exceptional 5.8% |
| Armenians | 99.9 /100 | #37 | Exceptional 5.8% |
| Immigrants | South America | 99.9 /100 | #38 | Exceptional 5.8% |
| Asians | 99.9 /100 | #39 | Exceptional 5.8% |
| Bolivians | 99.9 /100 | #40 | Exceptional 5.8% |
| Nicaraguans | 99.9 /100 | #41 | Exceptional 5.8% |
| Colombians | 99.8 /100 | #42 | Exceptional 5.9% |
| South Americans | 99.8 /100 | #43 | Exceptional 5.9% |
| Immigrants | Asia | 99.8 /100 | #44 | Exceptional 5.9% |
| Immigrants | Peru | 99.8 /100 | #45 | Exceptional 5.9% |
| Immigrants | Korea | 99.8 /100 | #46 | Exceptional 5.9% |
| Immigrants | Egypt | 99.8 /100 | #47 | Exceptional 5.9% |
| Immigrants | Trinidad and Tobago | 99.8 /100 | #48 | Exceptional 5.9% |
Demographics Similar to Immigrants from Burma/Myanmar by Disability Age 18 to 34
In terms of disability age 18 to 34, the demographic groups most similar to Immigrants from Burma/Myanmar are Immigrants from Scotland (6.8%, a difference of 0.020%), Mexican (6.8%, a difference of 0.040%), Japanese (6.8%, a difference of 0.080%), Lebanese (6.8%, a difference of 0.15%), and Immigrants from Bosnia and Herzegovina (6.8%, a difference of 0.20%).
| Demographics | Rating | Rank | Disability Age 18 to 34 |
| Panamanians | 15.8 /100 | #202 | Poor 6.8% |
| Hispanics or Latinos | 13.8 /100 | #203 | Poor 6.8% |
| Immigrants | Bosnia and Herzegovina | 13.6 /100 | #204 | Poor 6.8% |
| Lebanese | 13.3 /100 | #205 | Poor 6.8% |
| Japanese | 12.8 /100 | #206 | Poor 6.8% |
| Mexicans | 12.6 /100 | #207 | Poor 6.8% |
| Immigrants | Scotland | 12.4 /100 | #208 | Poor 6.8% |
| Immigrants | Burma/Myanmar | 12.3 /100 | #209 | Poor 6.8% |
| Latvians | 11.1 /100 | #210 | Poor 6.8% |
| Immigrants | Norway | 10.0 /100 | #211 | Tragic 6.8% |
| Luxembourgers | 9.4 /100 | #212 | Tragic 6.9% |
| Immigrants | Western Europe | 9.1 /100 | #213 | Tragic 6.9% |
| Serbians | 8.2 /100 | #214 | Tragic 6.9% |
| Immigrants | Thailand | 7.5 /100 | #215 | Tragic 6.9% |
| Sudanese | 7.0 /100 | #216 | Tragic 6.9% |