Nepalese vs English Disability Age 35 to 64
COMPARE
Nepalese
English
Disability Age 35 to 64
Disability Age 35 to 64 Comparison
Nepalese
English
12.8%
DISABILITY AGE 35 TO 64
0.1/ 100
METRIC RATING
271st/ 347
METRIC RANK
12.4%
DISABILITY AGE 35 TO 64
0.6/ 100
METRIC RATING
259th/ 347
METRIC RANK
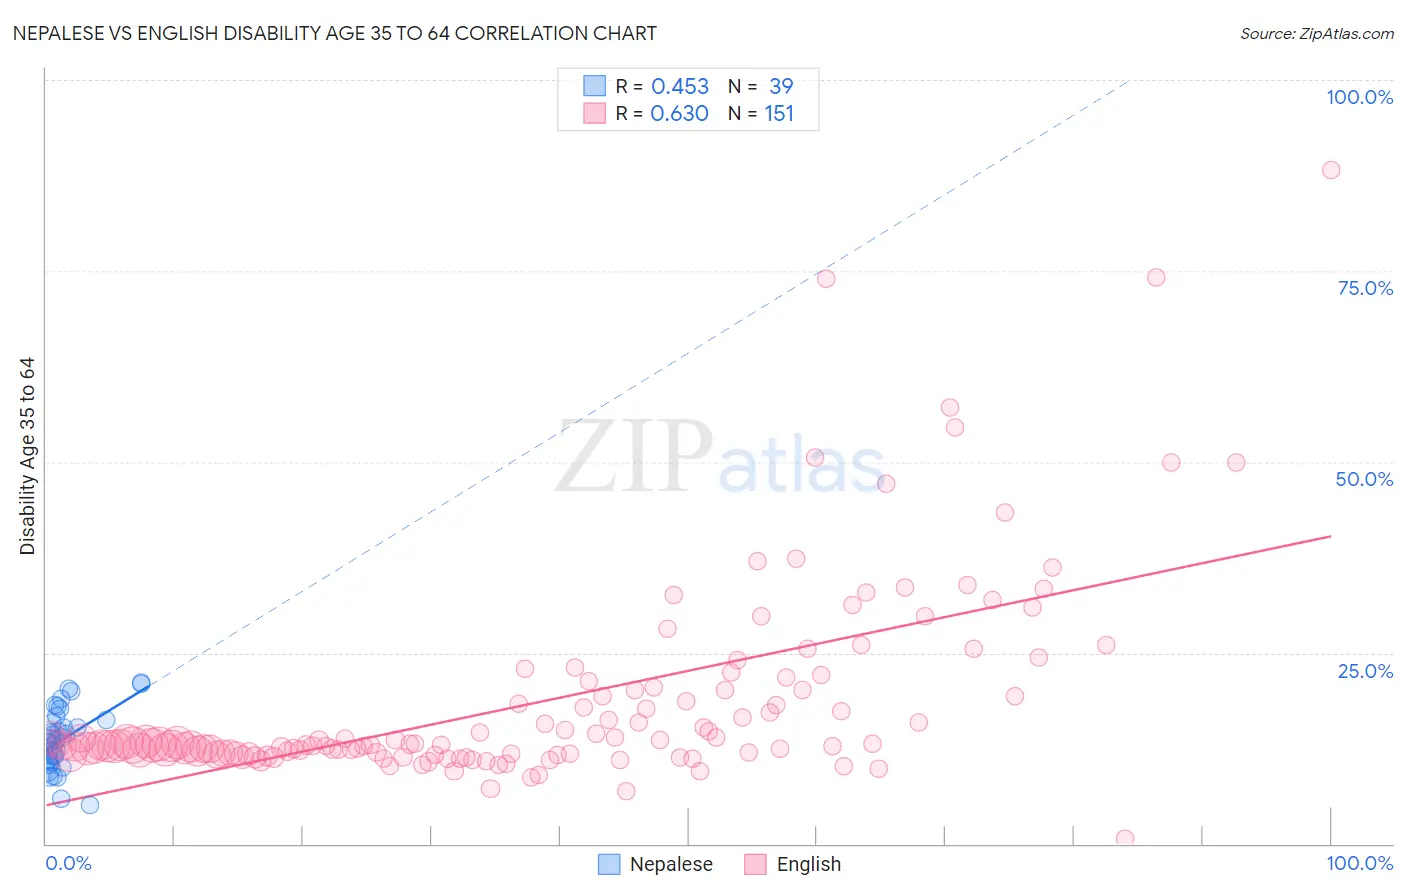
Nepalese vs English Disability Age 35 to 64 Correlation Chart
The statistical analysis conducted on geographies consisting of 24,500,920 people shows a moderate positive correlation between the proportion of Nepalese and percentage of population with a disability between the ages 34 and 64 in the United States with a correlation coefficient (R) of 0.453 and weighted average of 12.8%. Similarly, the statistical analysis conducted on geographies consisting of 578,471,169 people shows a significant positive correlation between the proportion of English and percentage of population with a disability between the ages 34 and 64 in the United States with a correlation coefficient (R) of 0.630 and weighted average of 12.4%, a difference of 3.2%.
Disability Age 35 to 64 Correlation Summary
| Measurement | Nepalese | English |
| Minimum | 5.1% | 0.65% |
| Maximum | 21.1% | 88.2% |
| Range | 16.0% | 87.6% |
| Mean | 13.7% | 18.7% |
| Median | 13.6% | 12.9% |
| Interquartile 25% (IQ1) | 10.9% | 11.8% |
| Interquartile 75% (IQ3) | 16.3% | 20.2% |
| Interquartile Range (IQR) | 5.3% | 8.4% |
| Standard Deviation (Sample) | 3.9% | 13.2% |
| Standard Deviation (Population) | 3.9% | 13.1% |
Demographics Similar to Nepalese and English by Disability Age 35 to 64
In terms of disability age 35 to 64, the demographic groups most similar to Nepalese are U.S. Virgin Islander (12.8%, a difference of 0.12%), Pennsylvania German (12.8%, a difference of 0.21%), Celtic (12.9%, a difference of 0.23%), Dominican (12.9%, a difference of 0.37%), and French (12.7%, a difference of 1.1%). Similarly, the demographic groups most similar to English are Welsh (12.4%, a difference of 0.12%), Mexican (12.4%, a difference of 0.20%), German Russian (12.5%, a difference of 0.25%), Malaysian (12.5%, a difference of 0.40%), and Scottish (12.4%, a difference of 0.46%).
| Demographics | Rating | Rank | Disability Age 35 to 64 |
| Japanese | 0.8 /100 | #255 | Tragic 12.3% |
| Scottish | 0.8 /100 | #256 | Tragic 12.4% |
| Mexicans | 0.7 /100 | #257 | Tragic 12.4% |
| Welsh | 0.6 /100 | #258 | Tragic 12.4% |
| English | 0.6 /100 | #259 | Tragic 12.4% |
| German Russians | 0.5 /100 | #260 | Tragic 12.5% |
| Malaysians | 0.5 /100 | #261 | Tragic 12.5% |
| Senegalese | 0.5 /100 | #262 | Tragic 12.5% |
| Immigrants | Zaire | 0.4 /100 | #263 | Tragic 12.5% |
| Immigrants | Portugal | 0.4 /100 | #264 | Tragic 12.5% |
| Marshallese | 0.4 /100 | #265 | Tragic 12.5% |
| Whites/Caucasians | 0.3 /100 | #266 | Tragic 12.6% |
| Sub-Saharan Africans | 0.2 /100 | #267 | Tragic 12.6% |
| Immigrants | Dominica | 0.2 /100 | #268 | Tragic 12.7% |
| Spanish | 0.2 /100 | #269 | Tragic 12.7% |
| French | 0.2 /100 | #270 | Tragic 12.7% |
| Nepalese | 0.1 /100 | #271 | Tragic 12.8% |
| U.S. Virgin Islanders | 0.1 /100 | #272 | Tragic 12.8% |
| Pennsylvania Germans | 0.1 /100 | #273 | Tragic 12.8% |
| Celtics | 0.1 /100 | #274 | Tragic 12.9% |
| Dominicans | 0.1 /100 | #275 | Tragic 12.9% |