Immigrants from Costa Rica vs Immigrants from Liberia Cognitive Disability
COMPARE
Immigrants from Costa Rica
Immigrants from Liberia
Cognitive Disability
Cognitive Disability Comparison
Immigrants from Costa Rica
Immigrants from Liberia
17.0%
COGNITIVE DISABILITY
93.1/ 100
METRIC RATING
127th/ 347
METRIC RANK
18.7%
COGNITIVE DISABILITY
0.0/ 100
METRIC RATING
322nd/ 347
METRIC RANK
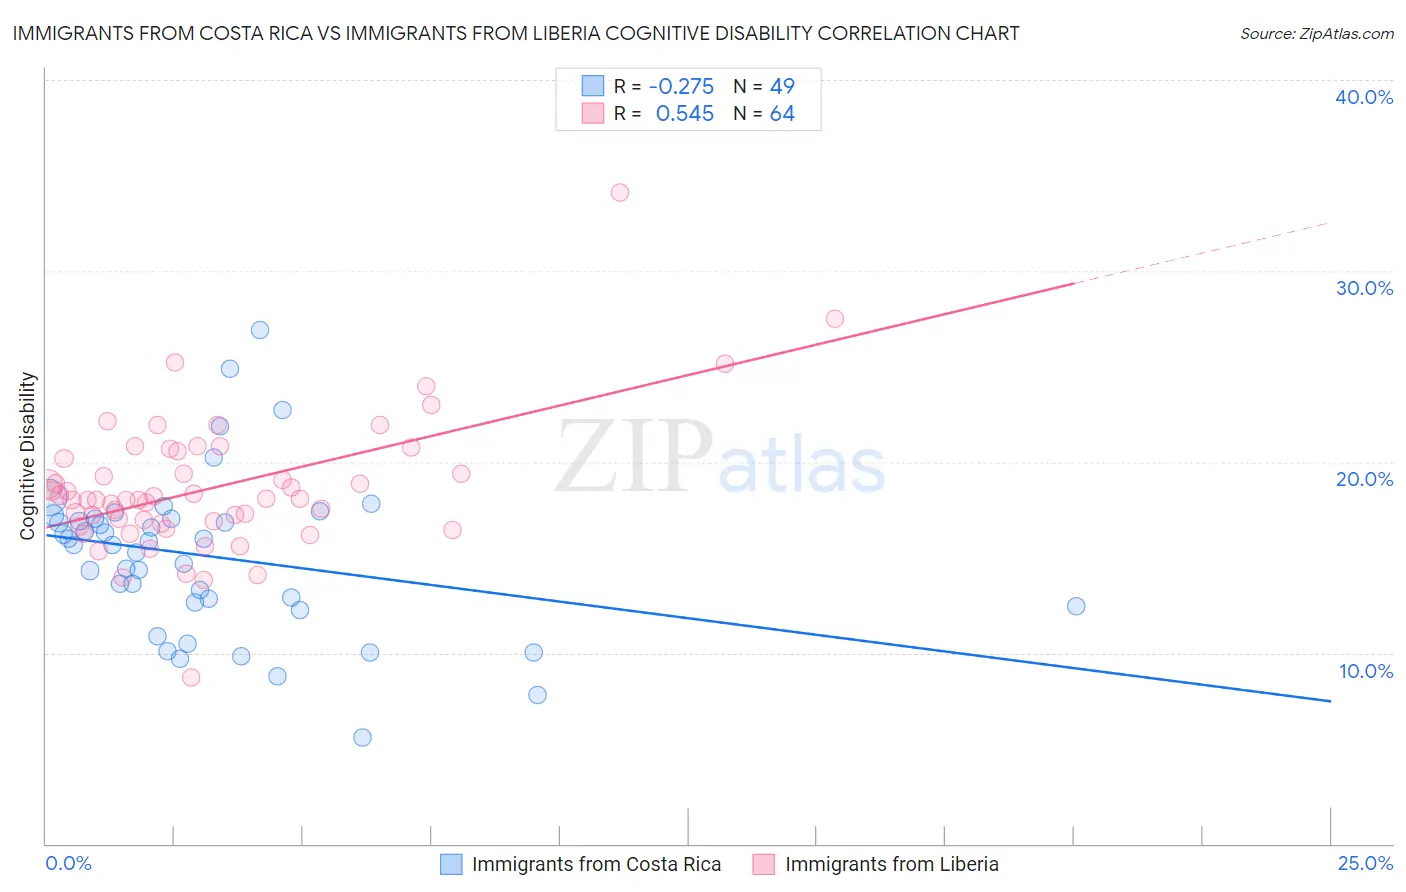
Immigrants from Costa Rica vs Immigrants from Liberia Cognitive Disability Correlation Chart
The statistical analysis conducted on geographies consisting of 204,266,656 people shows a weak negative correlation between the proportion of Immigrants from Costa Rica and percentage of population with cognitive disability in the United States with a correlation coefficient (R) of -0.275 and weighted average of 17.0%. Similarly, the statistical analysis conducted on geographies consisting of 135,261,320 people shows a substantial positive correlation between the proportion of Immigrants from Liberia and percentage of population with cognitive disability in the United States with a correlation coefficient (R) of 0.545 and weighted average of 18.7%, a difference of 10.0%.
Cognitive Disability Correlation Summary
| Measurement | Immigrants from Costa Rica | Immigrants from Liberia |
| Minimum | 5.6% | 8.7% |
| Maximum | 26.9% | 34.1% |
| Range | 21.3% | 25.4% |
| Mean | 15.1% | 18.7% |
| Median | 15.7% | 18.0% |
| Interquartile 25% (IQ1) | 12.6% | 16.8% |
| Interquartile 75% (IQ3) | 17.0% | 20.4% |
| Interquartile Range (IQR) | 4.5% | 3.6% |
| Standard Deviation (Sample) | 4.2% | 3.6% |
| Standard Deviation (Population) | 4.1% | 3.6% |
Similar Demographics by Cognitive Disability
Demographics Similar to Immigrants from Costa Rica by Cognitive Disability
In terms of cognitive disability, the demographic groups most similar to Immigrants from Costa Rica are Nicaraguan (17.0%, a difference of 0.010%), Immigrants from Uruguay (17.0%, a difference of 0.020%), European (17.0%, a difference of 0.040%), Immigrants from Vietnam (17.0%, a difference of 0.080%), and Immigrants from Germany (17.0%, a difference of 0.11%).
| Demographics | Rating | Rank | Cognitive Disability |
| Scottish | 95.0 /100 | #120 | Exceptional 16.9% |
| Immigrants | China | 94.9 /100 | #121 | Exceptional 16.9% |
| Immigrants | Western Europe | 94.8 /100 | #122 | Exceptional 16.9% |
| Portuguese | 94.7 /100 | #123 | Exceptional 16.9% |
| Turks | 94.5 /100 | #124 | Exceptional 16.9% |
| Scandinavians | 94.1 /100 | #125 | Exceptional 16.9% |
| Europeans | 93.4 /100 | #126 | Exceptional 17.0% |
| Immigrants | Costa Rica | 93.1 /100 | #127 | Exceptional 17.0% |
| Nicaraguans | 93.0 /100 | #128 | Exceptional 17.0% |
| Immigrants | Uruguay | 92.9 /100 | #129 | Exceptional 17.0% |
| Immigrants | Vietnam | 92.4 /100 | #130 | Exceptional 17.0% |
| Immigrants | Germany | 92.1 /100 | #131 | Exceptional 17.0% |
| Whites/Caucasians | 92.1 /100 | #132 | Exceptional 17.0% |
| Immigrants | Jordan | 91.9 /100 | #133 | Exceptional 17.0% |
| Immigrants | Chile | 91.7 /100 | #134 | Exceptional 17.0% |
Demographics Similar to Immigrants from Liberia by Cognitive Disability
In terms of cognitive disability, the demographic groups most similar to Immigrants from Liberia are Pueblo (18.7%, a difference of 0.020%), African (18.6%, a difference of 0.060%), Dominican (18.7%, a difference of 0.14%), Apache (18.6%, a difference of 0.16%), and Comanche (18.6%, a difference of 0.19%).
| Demographics | Rating | Rank | Cognitive Disability |
| Immigrants | Dominica | 0.0 /100 | #315 | Tragic 18.6% |
| Immigrants | Middle Africa | 0.0 /100 | #316 | Tragic 18.6% |
| Liberians | 0.0 /100 | #317 | Tragic 18.6% |
| Bangladeshis | 0.0 /100 | #318 | Tragic 18.6% |
| Comanche | 0.0 /100 | #319 | Tragic 18.6% |
| Apache | 0.0 /100 | #320 | Tragic 18.6% |
| Africans | 0.0 /100 | #321 | Tragic 18.6% |
| Immigrants | Liberia | 0.0 /100 | #322 | Tragic 18.7% |
| Pueblo | 0.0 /100 | #323 | Tragic 18.7% |
| Dominicans | 0.0 /100 | #324 | Tragic 18.7% |
| Indonesians | 0.0 /100 | #325 | Tragic 18.7% |
| Immigrants | Senegal | 0.0 /100 | #326 | Tragic 18.7% |
| U.S. Virgin Islanders | 0.0 /100 | #327 | Tragic 18.7% |
| Kiowa | 0.0 /100 | #328 | Tragic 18.7% |
| Navajo | 0.0 /100 | #329 | Tragic 18.8% |