South American Indian vs West Indian Female Disability
COMPARE
South American Indian
West Indian
Female Disability
Female Disability Comparison
South American Indians
West Indians
11.8%
FEMALE DISABILITY
95.8/ 100
METRIC RATING
127th/ 347
METRIC RANK
12.8%
FEMALE DISABILITY
0.5/ 100
METRIC RATING
265th/ 347
METRIC RANK
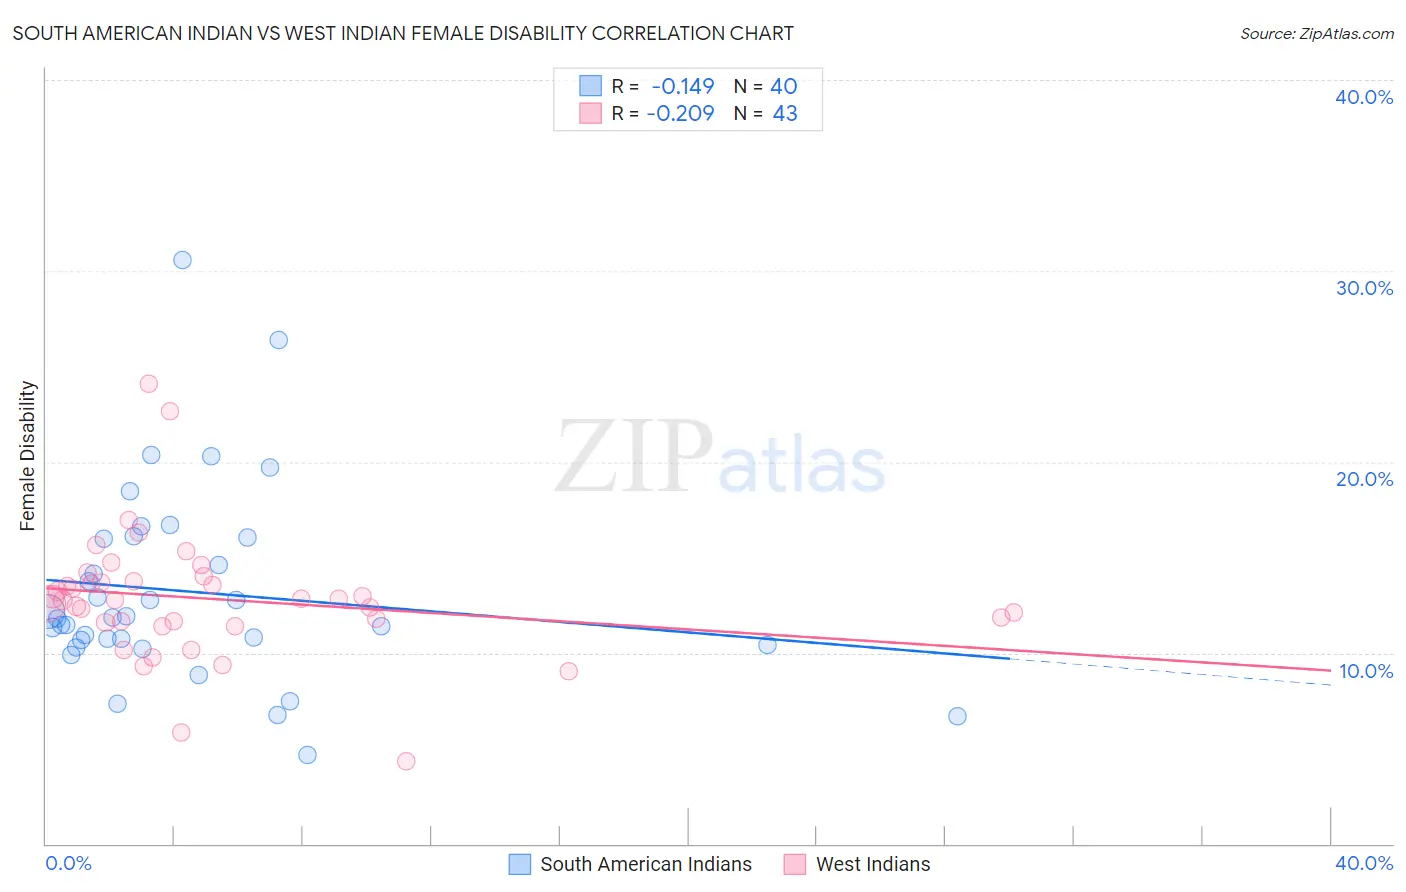
South American Indian vs West Indian Female Disability Correlation Chart
The statistical analysis conducted on geographies consisting of 164,561,575 people shows a poor negative correlation between the proportion of South American Indians and percentage of females with a disability in the United States with a correlation coefficient (R) of -0.149 and weighted average of 11.8%. Similarly, the statistical analysis conducted on geographies consisting of 254,014,904 people shows a weak negative correlation between the proportion of West Indians and percentage of females with a disability in the United States with a correlation coefficient (R) of -0.209 and weighted average of 12.8%, a difference of 8.2%.
Female Disability Correlation Summary
| Measurement | South American Indian | West Indian |
| Minimum | 4.7% | 4.3% |
| Maximum | 30.6% | 24.1% |
| Range | 25.9% | 19.8% |
| Mean | 13.2% | 12.8% |
| Median | 11.8% | 12.8% |
| Interquartile 25% (IQ1) | 10.5% | 11.6% |
| Interquartile 75% (IQ3) | 16.0% | 13.8% |
| Interquartile Range (IQR) | 5.5% | 2.2% |
| Standard Deviation (Sample) | 5.1% | 3.4% |
| Standard Deviation (Population) | 5.1% | 3.3% |
Similar Demographics by Female Disability
Demographics Similar to South American Indians by Female Disability
In terms of female disability, the demographic groups most similar to South American Indians are Immigrants from Latvia (11.8%, a difference of 0.040%), Macedonian (11.8%, a difference of 0.070%), Immigrants from Europe (11.8%, a difference of 0.10%), Nicaraguan (11.9%, a difference of 0.13%), and Arab (11.9%, a difference of 0.16%).
| Demographics | Rating | Rank | Female Disability |
| Immigrants | Kazakhstan | 97.0 /100 | #120 | Exceptional 11.8% |
| Immigrants | Netherlands | 96.9 /100 | #121 | Exceptional 11.8% |
| Immigrants | North Macedonia | 96.8 /100 | #122 | Exceptional 11.8% |
| Immigrants | Croatia | 96.7 /100 | #123 | Exceptional 11.8% |
| Russians | 96.5 /100 | #124 | Exceptional 11.8% |
| Immigrants | Italy | 96.4 /100 | #125 | Exceptional 11.8% |
| Immigrants | Europe | 96.2 /100 | #126 | Exceptional 11.8% |
| South American Indians | 95.8 /100 | #127 | Exceptional 11.8% |
| Immigrants | Latvia | 95.6 /100 | #128 | Exceptional 11.8% |
| Macedonians | 95.5 /100 | #129 | Exceptional 11.8% |
| Nicaraguans | 95.2 /100 | #130 | Exceptional 11.9% |
| Arabs | 95.1 /100 | #131 | Exceptional 11.9% |
| Immigrants | Syria | 94.6 /100 | #132 | Exceptional 11.9% |
| Kenyans | 94.5 /100 | #133 | Exceptional 11.9% |
| Immigrants | Nicaragua | 94.5 /100 | #134 | Exceptional 11.9% |
Demographics Similar to West Indians by Female Disability
In terms of female disability, the demographic groups most similar to West Indians are Finnish (12.8%, a difference of 0.12%), Senegalese (12.8%, a difference of 0.13%), Immigrants from Laos (12.8%, a difference of 0.16%), Alaska Native (12.8%, a difference of 0.19%), and Indonesian (12.8%, a difference of 0.22%).
| Demographics | Rating | Rank | Female Disability |
| Aleuts | 1.1 /100 | #258 | Tragic 12.7% |
| Immigrants | Armenia | 1.0 /100 | #259 | Tragic 12.7% |
| Sub-Saharan Africans | 1.0 /100 | #260 | Tragic 12.7% |
| Bermudans | 1.0 /100 | #261 | Tragic 12.7% |
| Czechoslovakians | 0.9 /100 | #262 | Tragic 12.7% |
| Spaniards | 0.7 /100 | #263 | Tragic 12.8% |
| Alaska Natives | 0.6 /100 | #264 | Tragic 12.8% |
| West Indians | 0.5 /100 | #265 | Tragic 12.8% |
| Finns | 0.4 /100 | #266 | Tragic 12.8% |
| Senegalese | 0.4 /100 | #267 | Tragic 12.8% |
| Immigrants | Laos | 0.4 /100 | #268 | Tragic 12.8% |
| Indonesians | 0.4 /100 | #269 | Tragic 12.8% |
| Immigrants | Liberia | 0.3 /100 | #270 | Tragic 12.9% |
| Dutch | 0.2 /100 | #271 | Tragic 12.9% |
| Germans | 0.1 /100 | #272 | Tragic 12.9% |