Malaysian vs Samoan Unemployment Among Seniors over 75 years
COMPARE
Malaysian
Samoan
Unemployment Among Seniors over 75 years
Unemployment Among Seniors over 75 years Comparison
Malaysians
Samoans
8.9%
UNEMPLOYMENT AMONG SENIORS OVER 75 YEARS
16.3/ 100
METRIC RATING
207th/ 347
METRIC RANK
9.1%
UNEMPLOYMENT AMONG SENIORS OVER 75 YEARS
5.7/ 100
METRIC RATING
227th/ 347
METRIC RANK
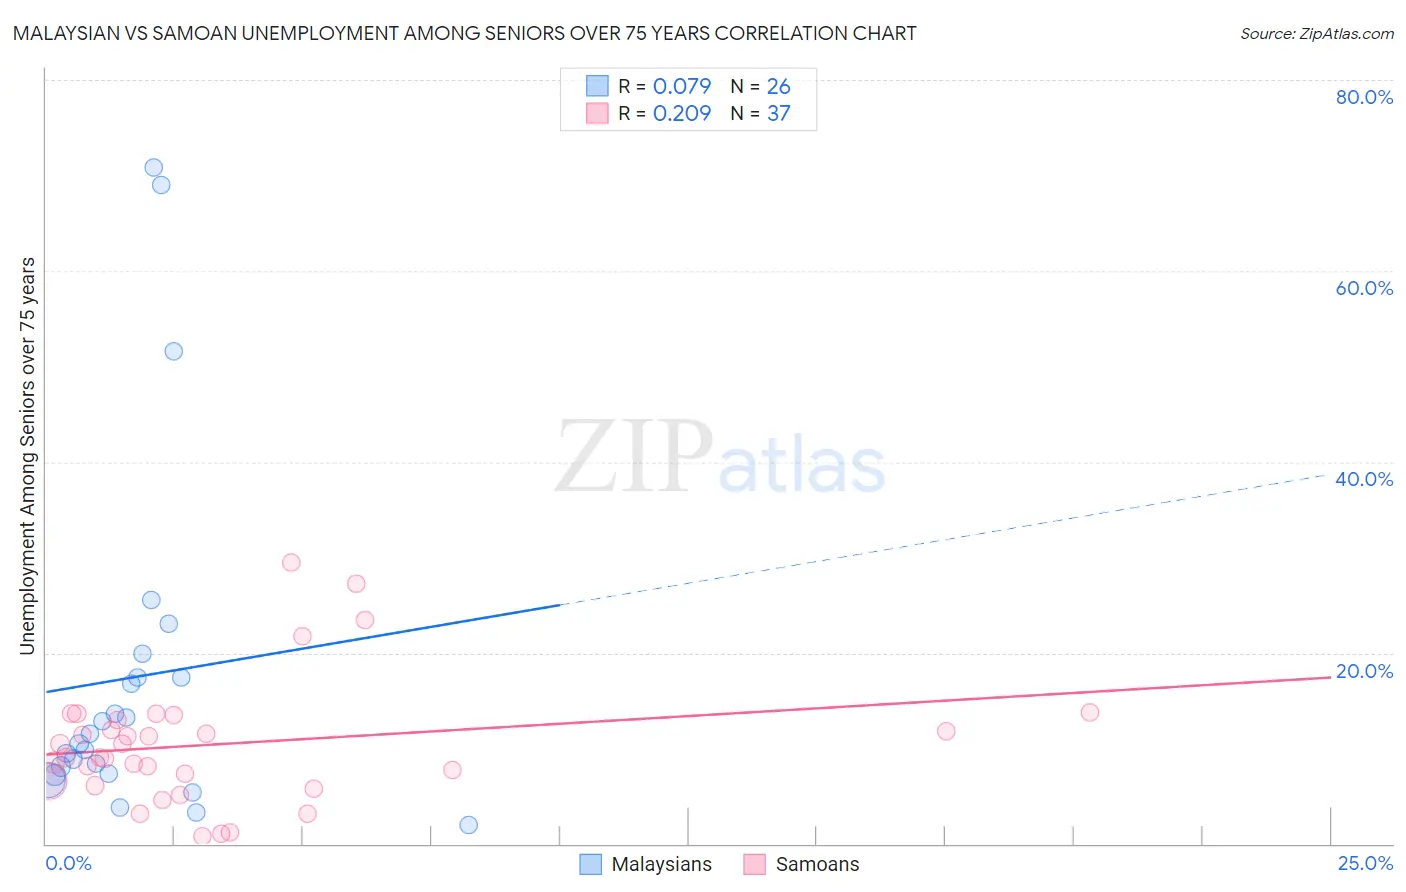
Malaysian vs Samoan Unemployment Among Seniors over 75 years Correlation Chart
The statistical analysis conducted on geographies consisting of 134,888,920 people shows a slight positive correlation between the proportion of Malaysians and unemployment rate among seniors over the age of 75 in the United States with a correlation coefficient (R) of 0.079 and weighted average of 8.9%. Similarly, the statistical analysis conducted on geographies consisting of 137,123,873 people shows a weak positive correlation between the proportion of Samoans and unemployment rate among seniors over the age of 75 in the United States with a correlation coefficient (R) of 0.209 and weighted average of 9.1%, a difference of 1.5%.
Unemployment Among Seniors over 75 years Correlation Summary
| Measurement | Malaysian | Samoan |
| Minimum | 1.9% | 0.80% |
| Maximum | 70.8% | 29.4% |
| Range | 68.9% | 28.6% |
| Mean | 17.4% | 10.4% |
| Median | 11.0% | 9.1% |
| Interquartile 25% (IQ1) | 7.3% | 6.3% |
| Interquartile 75% (IQ3) | 17.4% | 13.2% |
| Interquartile Range (IQR) | 10.1% | 6.9% |
| Standard Deviation (Sample) | 18.3% | 6.5% |
| Standard Deviation (Population) | 17.9% | 6.5% |
Demographics Similar to Malaysians and Samoans by Unemployment Among Seniors over 75 years
In terms of unemployment among seniors over 75 years, the demographic groups most similar to Malaysians are Immigrants from Philippines (8.9%, a difference of 0.040%), Salvadoran (8.9%, a difference of 0.090%), Bermudan (8.9%, a difference of 0.13%), Delaware (9.0%, a difference of 0.17%), and Romanian (9.0%, a difference of 0.26%). Similarly, the demographic groups most similar to Samoans are Immigrants from Bangladesh (9.1%, a difference of 0.050%), Navajo (9.1%, a difference of 0.10%), Costa Rican (9.1%, a difference of 0.14%), Immigrants from Jordan (9.0%, a difference of 0.28%), and Peruvian (9.0%, a difference of 0.34%).
| Demographics | Rating | Rank | Unemployment Among Seniors over 75 years |
| Malaysians | 16.3 /100 | #207 | Poor 8.9% |
| Immigrants | Philippines | 15.8 /100 | #208 | Poor 8.9% |
| Salvadorans | 15.4 /100 | #209 | Poor 8.9% |
| Bermudans | 15.0 /100 | #210 | Poor 8.9% |
| Delaware | 14.6 /100 | #211 | Poor 9.0% |
| Romanians | 13.8 /100 | #212 | Poor 9.0% |
| Immigrants | Latin America | 13.4 /100 | #213 | Poor 9.0% |
| Immigrants | Brazil | 13.3 /100 | #214 | Poor 9.0% |
| Immigrants | Western Asia | 12.5 /100 | #215 | Poor 9.0% |
| Immigrants | Oceania | 11.8 /100 | #216 | Poor 9.0% |
| Lebanese | 11.1 /100 | #217 | Poor 9.0% |
| Immigrants | Africa | 9.7 /100 | #218 | Tragic 9.0% |
| Afghans | 8.3 /100 | #219 | Tragic 9.0% |
| Immigrants | Zimbabwe | 7.8 /100 | #220 | Tragic 9.0% |
| Guamanians/Chamorros | 7.7 /100 | #221 | Tragic 9.0% |
| Peruvians | 7.3 /100 | #222 | Tragic 9.0% |
| Immigrants | Jordan | 6.9 /100 | #223 | Tragic 9.0% |
| Costa Ricans | 6.3 /100 | #224 | Tragic 9.1% |
| Navajo | 6.1 /100 | #225 | Tragic 9.1% |
| Immigrants | Bangladesh | 5.9 /100 | #226 | Tragic 9.1% |
| Samoans | 5.7 /100 | #227 | Tragic 9.1% |