Lumbee vs Creek Disability Age 65 to 74
COMPARE
Lumbee
Creek
Disability Age 65 to 74
Disability Age 65 to 74 Comparison
Lumbee
Creek
32.7%
DISABILITY AGE 65 TO 74
0.0/ 100
METRIC RATING
340th/ 347
METRIC RANK
30.2%
DISABILITY AGE 65 TO 74
0.0/ 100
METRIC RATING
330th/ 347
METRIC RANK
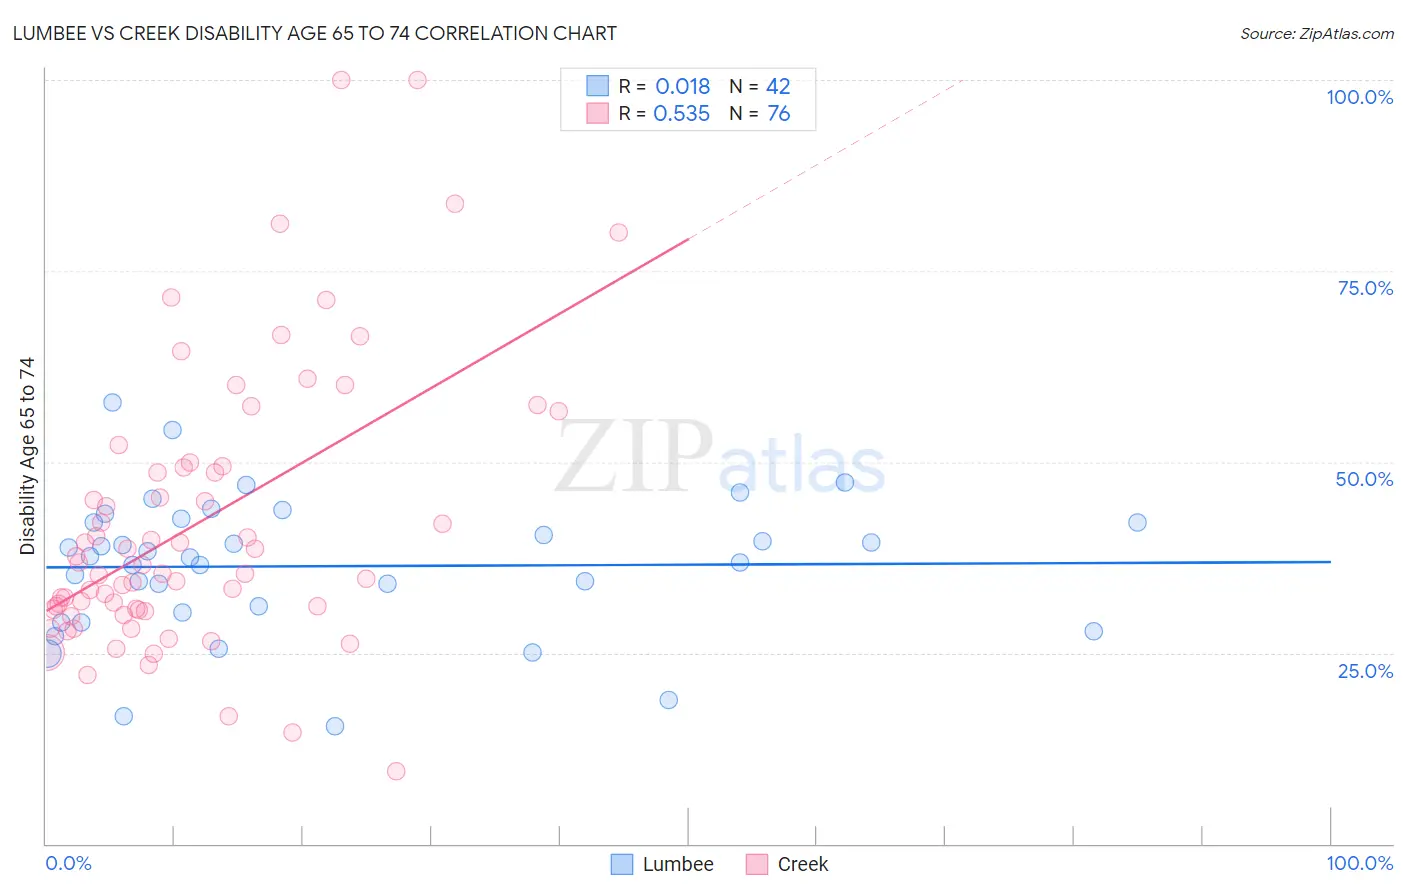
Lumbee vs Creek Disability Age 65 to 74 Correlation Chart
The statistical analysis conducted on geographies consisting of 92,106,764 people shows no correlation between the proportion of Lumbee and percentage of population with a disability between the ages 65 and 75 in the United States with a correlation coefficient (R) of 0.018 and weighted average of 32.7%. Similarly, the statistical analysis conducted on geographies consisting of 178,280,252 people shows a substantial positive correlation between the proportion of Creek and percentage of population with a disability between the ages 65 and 75 in the United States with a correlation coefficient (R) of 0.535 and weighted average of 30.2%, a difference of 8.4%.
Disability Age 65 to 74 Correlation Summary
| Measurement | Lumbee | Creek |
| Minimum | 15.4% | 9.4% |
| Maximum | 57.9% | 100.0% |
| Range | 42.5% | 90.6% |
| Mean | 36.3% | 41.9% |
| Median | 37.5% | 35.9% |
| Interquartile 25% (IQ1) | 30.3% | 30.7% |
| Interquartile 75% (IQ3) | 42.0% | 49.3% |
| Interquartile Range (IQR) | 11.7% | 18.6% |
| Standard Deviation (Sample) | 9.1% | 18.2% |
| Standard Deviation (Population) | 9.0% | 18.1% |
Demographics Similar to Lumbee and Creek by Disability Age 65 to 74
In terms of disability age 65 to 74, the demographic groups most similar to Lumbee are Kiowa (32.6%, a difference of 0.52%), Tsimshian (32.9%, a difference of 0.53%), Pueblo (33.1%, a difference of 1.1%), Alaskan Athabascan (32.4%, a difference of 1.1%), and Houma (32.3%, a difference of 1.3%). Similarly, the demographic groups most similar to Creek are Chickasaw (30.2%, a difference of 0.010%), Choctaw (30.2%, a difference of 0.030%), Native/Alaskan (30.4%, a difference of 0.63%), Hopi (30.0%, a difference of 0.83%), and Colville (30.5%, a difference of 1.1%).
| Demographics | Rating | Rank | Disability Age 65 to 74 |
| Dutch West Indians | 0.0 /100 | #325 | Tragic 29.6% |
| Yakama | 0.0 /100 | #326 | Tragic 29.6% |
| Apache | 0.0 /100 | #327 | Tragic 29.7% |
| Hopi | 0.0 /100 | #328 | Tragic 30.0% |
| Choctaw | 0.0 /100 | #329 | Tragic 30.2% |
| Creek | 0.0 /100 | #330 | Tragic 30.2% |
| Chickasaw | 0.0 /100 | #331 | Tragic 30.2% |
| Natives/Alaskans | 0.0 /100 | #332 | Tragic 30.4% |
| Colville | 0.0 /100 | #333 | Tragic 30.5% |
| Alaska Natives | 0.0 /100 | #334 | Tragic 30.6% |
| Cheyenne | 0.0 /100 | #335 | Tragic 31.1% |
| Yuman | 0.0 /100 | #336 | Tragic 31.5% |
| Houma | 0.0 /100 | #337 | Tragic 32.3% |
| Alaskan Athabascans | 0.0 /100 | #338 | Tragic 32.4% |
| Kiowa | 0.0 /100 | #339 | Tragic 32.6% |
| Lumbee | 0.0 /100 | #340 | Tragic 32.7% |
| Tsimshian | 0.0 /100 | #341 | Tragic 32.9% |
| Pueblo | 0.0 /100 | #342 | Tragic 33.1% |
| Navajo | 0.0 /100 | #343 | Tragic 33.3% |
| Inupiat | 0.0 /100 | #344 | Tragic 34.5% |
| Tohono O'odham | 0.0 /100 | #345 | Tragic 36.0% |