Immigrants from Northern Africa vs Creek Disability Age 65 to 74
COMPARE
Immigrants from Northern Africa
Creek
Disability Age 65 to 74
Disability Age 65 to 74 Comparison
Immigrants from Northern Africa
Creek
22.4%
DISABILITY AGE 65 TO 74
94.7/ 100
METRIC RATING
119th/ 347
METRIC RANK
30.2%
DISABILITY AGE 65 TO 74
0.0/ 100
METRIC RATING
330th/ 347
METRIC RANK
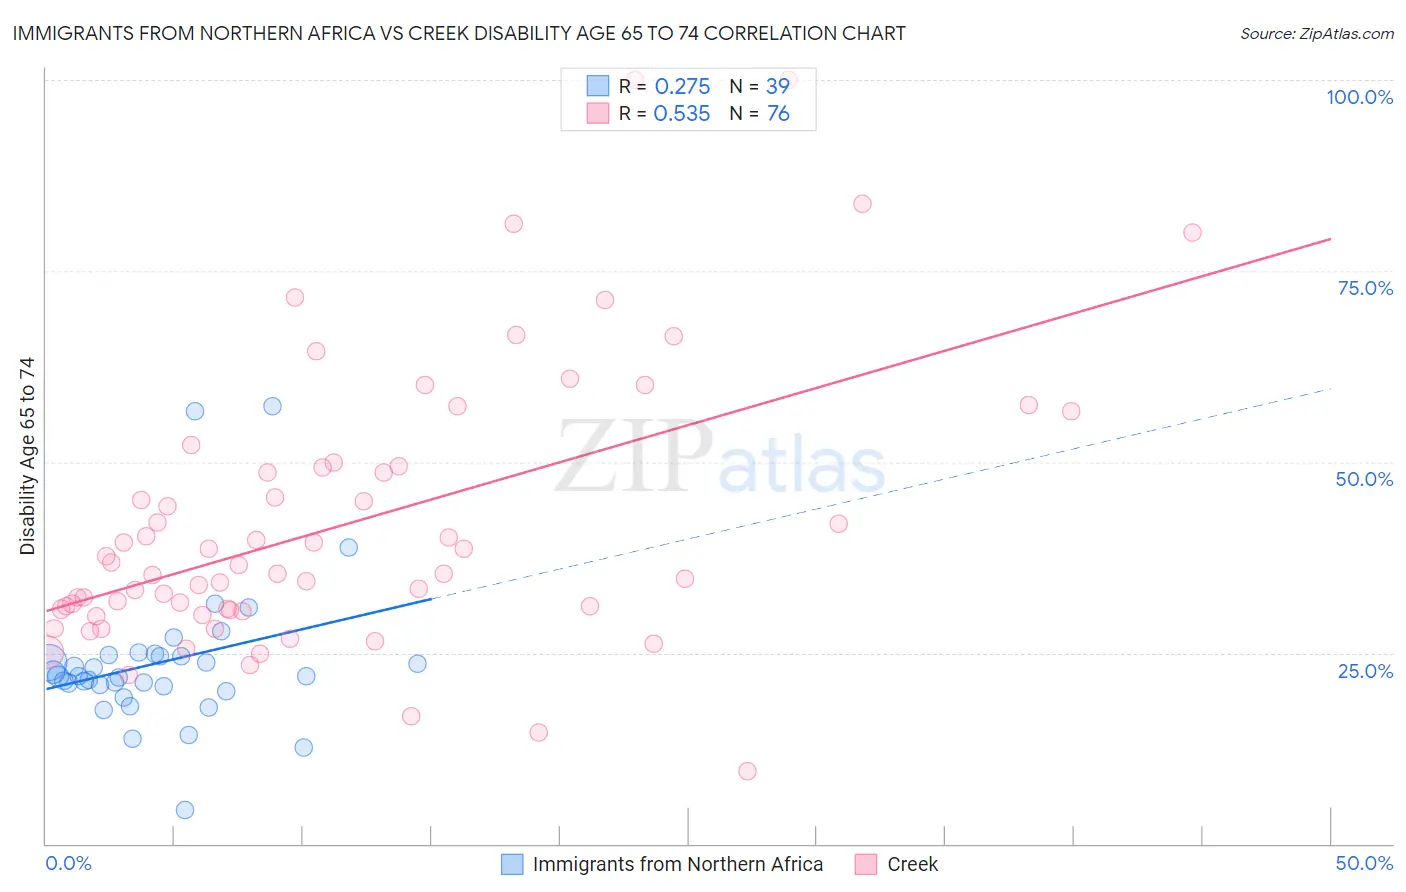
Immigrants from Northern Africa vs Creek Disability Age 65 to 74 Correlation Chart
The statistical analysis conducted on geographies consisting of 320,869,061 people shows a weak positive correlation between the proportion of Immigrants from Northern Africa and percentage of population with a disability between the ages 65 and 75 in the United States with a correlation coefficient (R) of 0.275 and weighted average of 22.4%. Similarly, the statistical analysis conducted on geographies consisting of 178,280,252 people shows a substantial positive correlation between the proportion of Creek and percentage of population with a disability between the ages 65 and 75 in the United States with a correlation coefficient (R) of 0.535 and weighted average of 30.2%, a difference of 35.1%.
Disability Age 65 to 74 Correlation Summary
| Measurement | Immigrants from Northern Africa | Creek |
| Minimum | 4.4% | 9.4% |
| Maximum | 57.3% | 100.0% |
| Range | 52.9% | 90.6% |
| Mean | 23.8% | 41.9% |
| Median | 21.9% | 35.9% |
| Interquartile 25% (IQ1) | 20.6% | 30.7% |
| Interquartile 75% (IQ3) | 24.7% | 49.3% |
| Interquartile Range (IQR) | 4.1% | 18.6% |
| Standard Deviation (Sample) | 9.6% | 18.2% |
| Standard Deviation (Population) | 9.5% | 18.1% |
Similar Demographics by Disability Age 65 to 74
Demographics Similar to Immigrants from Northern Africa by Disability Age 65 to 74
In terms of disability age 65 to 74, the demographic groups most similar to Immigrants from Northern Africa are Swedish (22.4%, a difference of 0.010%), Austrian (22.4%, a difference of 0.010%), Brazilian (22.4%, a difference of 0.020%), Laotian (22.3%, a difference of 0.060%), and Ukrainian (22.3%, a difference of 0.12%).
| Demographics | Rating | Rank | Disability Age 65 to 74 |
| Immigrants | South America | 95.5 /100 | #112 | Exceptional 22.3% |
| Syrians | 95.3 /100 | #113 | Exceptional 22.3% |
| Ukrainians | 95.1 /100 | #114 | Exceptional 22.3% |
| Laotians | 94.9 /100 | #115 | Exceptional 22.3% |
| Brazilians | 94.8 /100 | #116 | Exceptional 22.4% |
| Swedes | 94.7 /100 | #117 | Exceptional 22.4% |
| Austrians | 94.7 /100 | #118 | Exceptional 22.4% |
| Immigrants | Northern Africa | 94.7 /100 | #119 | Exceptional 22.4% |
| Immigrants | Kazakhstan | 93.9 /100 | #120 | Exceptional 22.4% |
| Czechs | 93.5 /100 | #121 | Exceptional 22.4% |
| Immigrants | Jordan | 93.5 /100 | #122 | Exceptional 22.4% |
| Hungarians | 93.3 /100 | #123 | Exceptional 22.4% |
| Norwegians | 92.5 /100 | #124 | Exceptional 22.5% |
| Immigrants | Western Europe | 92.3 /100 | #125 | Exceptional 22.5% |
| Lebanese | 92.2 /100 | #126 | Exceptional 22.5% |
Demographics Similar to Creek by Disability Age 65 to 74
In terms of disability age 65 to 74, the demographic groups most similar to Creek are Chickasaw (30.2%, a difference of 0.010%), Choctaw (30.2%, a difference of 0.030%), Native/Alaskan (30.4%, a difference of 0.63%), Hopi (30.0%, a difference of 0.83%), and Colville (30.5%, a difference of 1.1%).
| Demographics | Rating | Rank | Disability Age 65 to 74 |
| Puerto Ricans | 0.0 /100 | #323 | Tragic 29.1% |
| Seminole | 0.0 /100 | #324 | Tragic 29.4% |
| Dutch West Indians | 0.0 /100 | #325 | Tragic 29.6% |
| Yakama | 0.0 /100 | #326 | Tragic 29.6% |
| Apache | 0.0 /100 | #327 | Tragic 29.7% |
| Hopi | 0.0 /100 | #328 | Tragic 30.0% |
| Choctaw | 0.0 /100 | #329 | Tragic 30.2% |
| Creek | 0.0 /100 | #330 | Tragic 30.2% |
| Chickasaw | 0.0 /100 | #331 | Tragic 30.2% |
| Natives/Alaskans | 0.0 /100 | #332 | Tragic 30.4% |
| Colville | 0.0 /100 | #333 | Tragic 30.5% |
| Alaska Natives | 0.0 /100 | #334 | Tragic 30.6% |
| Cheyenne | 0.0 /100 | #335 | Tragic 31.1% |
| Yuman | 0.0 /100 | #336 | Tragic 31.5% |
| Houma | 0.0 /100 | #337 | Tragic 32.3% |