Immigrants from Zaire vs Filipino Cognitive Disability
COMPARE
Immigrants from Zaire
Filipino
Cognitive Disability
Cognitive Disability Comparison
Immigrants from Zaire
Filipinos
19.4%
COGNITIVE DISABILITY
0.0/ 100
METRIC RATING
343rd/ 347
METRIC RANK
16.4%
COGNITIVE DISABILITY
99.9/ 100
METRIC RATING
29th/ 347
METRIC RANK
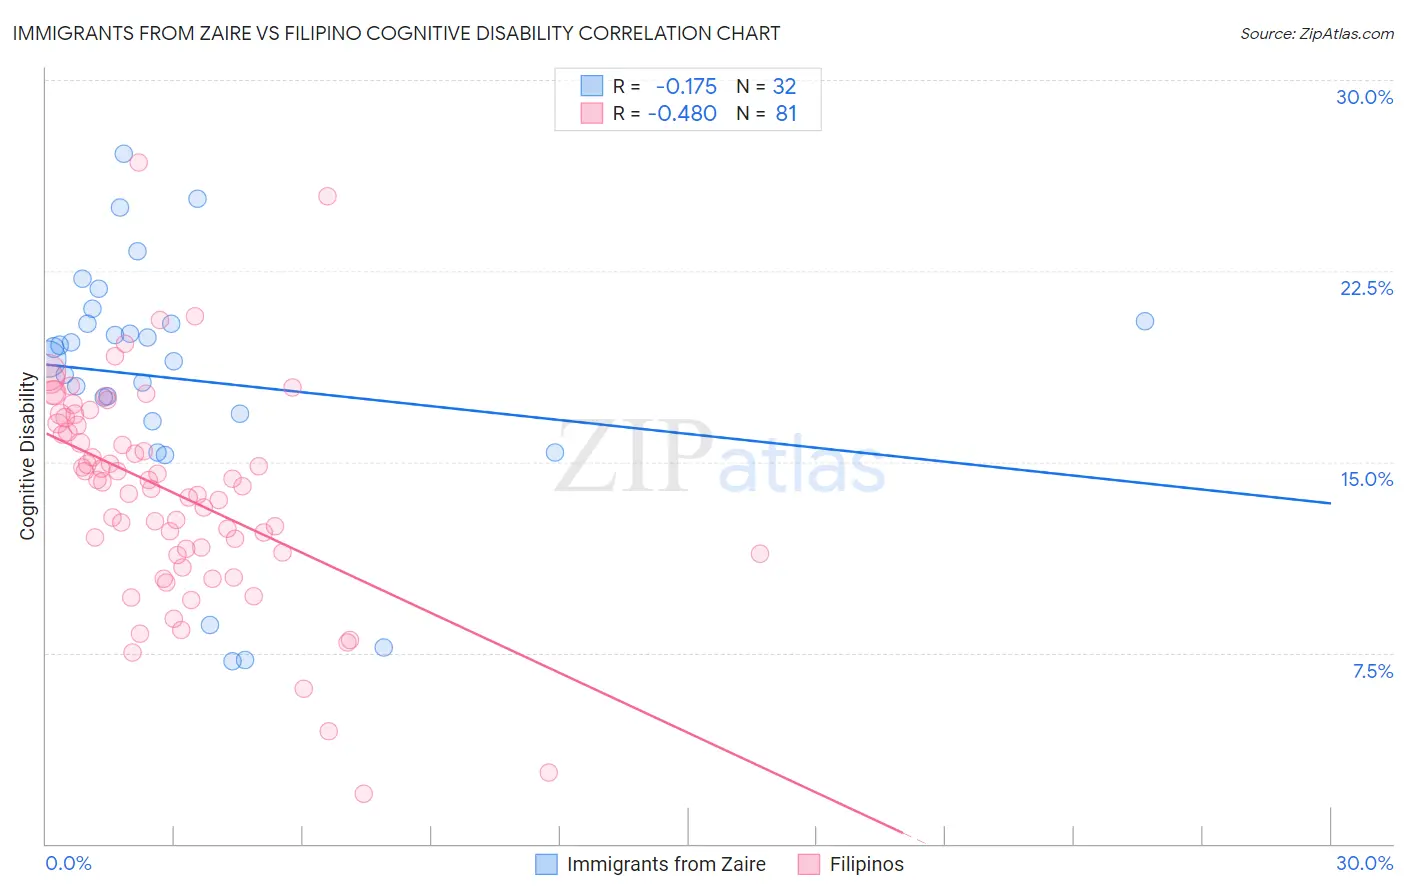
Immigrants from Zaire vs Filipino Cognitive Disability Correlation Chart
The statistical analysis conducted on geographies consisting of 107,255,223 people shows a poor negative correlation between the proportion of Immigrants from Zaire and percentage of population with cognitive disability in the United States with a correlation coefficient (R) of -0.175 and weighted average of 19.4%. Similarly, the statistical analysis conducted on geographies consisting of 254,348,780 people shows a moderate negative correlation between the proportion of Filipinos and percentage of population with cognitive disability in the United States with a correlation coefficient (R) of -0.480 and weighted average of 16.4%, a difference of 18.4%.
Cognitive Disability Correlation Summary
| Measurement | Immigrants from Zaire | Filipino |
| Minimum | 7.2% | 2.0% |
| Maximum | 27.1% | 26.8% |
| Range | 19.9% | 24.8% |
| Mean | 18.2% | 13.8% |
| Median | 19.3% | 14.2% |
| Interquartile 25% (IQ1) | 16.8% | 11.4% |
| Interquartile 75% (IQ3) | 20.5% | 16.6% |
| Interquartile Range (IQR) | 3.7% | 5.2% |
| Standard Deviation (Sample) | 4.9% | 4.3% |
| Standard Deviation (Population) | 4.8% | 4.2% |
Similar Demographics by Cognitive Disability
Demographics Similar to Immigrants from Zaire by Cognitive Disability
In terms of cognitive disability, the demographic groups most similar to Immigrants from Zaire are Tohono O'odham (19.3%, a difference of 0.69%), Houma (19.3%, a difference of 0.69%), Cape Verdean (19.2%, a difference of 0.93%), Puerto Rican (19.2%, a difference of 0.96%), and Lumbee (19.1%, a difference of 1.4%).
| Demographics | Rating | Rank | Cognitive Disability |
| Immigrants | Yemen | 0.0 /100 | #333 | Tragic 18.8% |
| Sudanese | 0.0 /100 | #334 | Tragic 18.9% |
| Senegalese | 0.0 /100 | #335 | Tragic 19.0% |
| Blacks/African Americans | 0.0 /100 | #336 | Tragic 19.0% |
| Immigrants | Saudi Arabia | 0.0 /100 | #337 | Tragic 19.1% |
| Lumbee | 0.0 /100 | #338 | Tragic 19.1% |
| Puerto Ricans | 0.0 /100 | #339 | Tragic 19.2% |
| Cape Verdeans | 0.0 /100 | #340 | Tragic 19.2% |
| Tohono O'odham | 0.0 /100 | #341 | Tragic 19.3% |
| Houma | 0.0 /100 | #342 | Tragic 19.3% |
| Immigrants | Zaire | 0.0 /100 | #343 | Tragic 19.4% |
| Immigrants | Congo | 0.0 /100 | #344 | Tragic 19.7% |
| Somalis | 0.0 /100 | #345 | Tragic 19.8% |
| Immigrants | Cabo Verde | 0.0 /100 | #346 | Tragic 19.9% |
| Immigrants | Somalia | 0.0 /100 | #347 | Tragic 20.0% |
Demographics Similar to Filipinos by Cognitive Disability
In terms of cognitive disability, the demographic groups most similar to Filipinos are Czech (16.4%, a difference of 0.0%), Immigrants from Romania (16.4%, a difference of 0.020%), Immigrants from Pakistan (16.4%, a difference of 0.030%), Polish (16.4%, a difference of 0.030%), and Immigrants from Croatia (16.4%, a difference of 0.050%).
| Demographics | Rating | Rank | Cognitive Disability |
| Immigrants | South Central Asia | 99.9 /100 | #22 | Exceptional 16.4% |
| Croatians | 99.9 /100 | #23 | Exceptional 16.4% |
| Immigrants | Argentina | 99.9 /100 | #24 | Exceptional 16.4% |
| Luxembourgers | 99.9 /100 | #25 | Exceptional 16.4% |
| Immigrants | Croatia | 99.9 /100 | #26 | Exceptional 16.4% |
| Immigrants | Pakistan | 99.9 /100 | #27 | Exceptional 16.4% |
| Poles | 99.9 /100 | #28 | Exceptional 16.4% |
| Filipinos | 99.9 /100 | #29 | Exceptional 16.4% |
| Czechs | 99.9 /100 | #30 | Exceptional 16.4% |
| Immigrants | Romania | 99.9 /100 | #31 | Exceptional 16.4% |
| Immigrants | Israel | 99.9 /100 | #32 | Exceptional 16.4% |
| Italians | 99.9 /100 | #33 | Exceptional 16.4% |
| Russians | 99.9 /100 | #34 | Exceptional 16.4% |
| Slovaks | 99.9 /100 | #35 | Exceptional 16.4% |
| Greeks | 99.9 /100 | #36 | Exceptional 16.4% |